
Menu
Documentation Grafana Cloud
Observe and act
Test and validate
Synthetic Monitoring
Set up
Private probes
Grafana Cloud
Observe and act
Test and validate
Synthetic Monitoring
Set up
Private probesGrafana Cloud
Last reviewed: October 22, 2026Private probes
A private probe is a Synthetic Monitoring probe that you install in your environment or another location you choose. It runs checks against the applications and services you monitor by sending requests and recording the responses.
Unlike public probes operated by Grafana Labs, private probes are only accessible to you and only write data to your Grafana Cloud account. Private probes are instances of the open source Grafana Synthetic Monitoring Agent.
This section includes the following topics:
- Set up a private probe
Register a Synthetic Monitoring private probe, install the agent using APT, YUM, Docker, or Kubernetes, and assign checks to run from your environment. - Network and resource requirements
Review Synthetic Monitoring private probe firewall access for service connections, script imports, and monitored targets, and estimate CPU and memory requirements. - Configure
Configure Synthetic Monitoring private probe feature flags, access to private IP addresses, browser check requirements, and anonymous usage statistics reporting. - Monitor private probes
Collect Prometheus-style metrics from the Synthetic Monitoring Agent to monitor private probes with Prometheus or Grafana Alloy. - Troubleshoot
Troubleshoot Synthetic Monitoring private probes by checking agent versions, authentication, API connectivity, logs, and metrics, and find community or account support.
Was this page helpful?
Related resources from Grafana Labs

Video
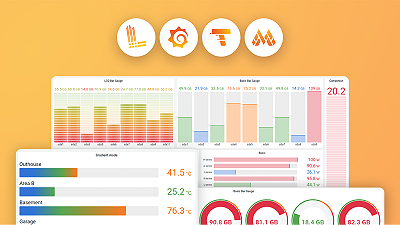
Getting started with managing your metrics, logs, and traces using Grafana
In this webinar, we’ll demo how to get started using the LGTM Stack: Loki for logs, Grafana for visualization, Tempo for traces, and Mimir for metrics.
Video

Start with Grafana Assistant
Learn how Grafana Assistant helps teams get answers faster using AI—without writing PromQL. Join this webinar to discover prompting best practices and security FAQs.
Video

Building advanced Grafana dashboards
In this webinar, we’ll demo how to build and format Grafana dashboards.