This is documentation for the next version of Grafana documentation. For the latest stable release, go to the latest version.
Add variables
In addition to the built-in global variables that come with Grafana, you can create your own variables. The following table lists the types of variables you can create:
Enter General options for any variable
You must enter general options for any type of variable that you create. To create a variable, follow these steps:
- Click Edit in the top-right corner of the dashboard.
- In the toolbar, click the Dashboard options icon to open the sidebar.
- In the sidebar, click Settings.
- Go to the Variables tab.
- Click Add variable, or if there are already variables, + New variable.
- Choose an option in the Select variable type drop-down list.
Enter a Name for the variable.
(Optional) In the Label field, enter the display name for the variable drop-down list.
If you don’t enter a display name, then the drop-down list label is the variable name.
(Optional) In the Description field, enter a description of the variable. The description appears as an info icon tooltip next to the variable name on the dashboard.
Descriptions support links. You can use Markdown-style links (
[link text](https://example.com)) or paste bare URLs (https://example.com). OnlyhttpandhttpsURLs are rendered as clickable links — other protocols are displayed as plain text.Choose a Display option:
- Above dashboard - The variable drop-down list displays above the dashboard with the variable Name or Label value. This is the default.
- Above dashboard, label hidden - The variable drop-down list displays above the dashboard, but without showing the name of the variable.
- Controls menu - The variable is displayed in the dashboard controls menu instead of above the dashboard. The dashboard controls menu appears as a button in the dashboard toolbar.
- Hidden - No variable drop-down list is displayed on the dashboard.
- Click one of the following links to complete the steps for adding your selected variable type:
Tip
To add variables without leaving the dashboard, click the Add new element icon in the dashboard toolbar, and select Variable. For more information, refer to the Dashboard controls documentation.
Variable best practices
- Variable drop-down lists are displayed in the order in which they’re listed in the Variables in dashboard settings, so put the variables that you will change often at the top, so they will be shown first (far left on the dashboard).
- By default, variables don’t have a default value. This means that the topmost value in the drop-down list is always preselected. If you want to pre-populate a variable with an empty value, you can use the following workaround in the variable settings:
- Select the Include All Option checkbox.
- In the Custom all value field, enter a value like
.+.
Add a query variable
Query variables enable you to write a data source query that can return a list of metric names, tag values, or keys. For example, a query variable might return a list of server names, sensor IDs, or data centers. The variable values change as they dynamically fetch options with a data source query.
Query variables are generally only supported for strings. If your query returns numbers or any other data type, you might need to convert them to strings to use them as variables. For the Azure data source, for example, you can use the tostring function for this purpose.
Query expressions can contain references to other variables and in effect create linked variables. Grafana detects this and automatically refreshes a variable when one of its linked variables change.
Note
Query expressions are different for each data source. For more information, refer to the documentation for your data source.
Configure the following options:
Click Run query to test the variable.
In the Preview of values section, Grafana displays a list of the current variable values. Review them to ensure they match what you expect.
Click Save in the top-right corner.
Enter an optional description of your changes and click Save.
Click Back to list to add or edit other variables, or Back to dashboard and then Exit edit.
Query type
The query field varies according to your data source. Some data sources have custom query editors.
Each data source defines how the variable values are extracted. The typical implementation uses every string value returned from the data source response as a variable value. Make sure to double-check the documentation for the data source.
Some data sources let you provide custom “display names” for the values.
For instance, the PostgreSQL, MySQL, and Microsoft SQL Server plugins handle this by looking for fields named __text and __value in the result.
Other data sources may look for text and value or use a different approach.
Always remember to double-check the documentation for the data source.
If you need more room in a single input field query editor, then hover your cursor over the lines in the lower right corner of the field and drag downward to expand.
Add a custom variable
Use a custom variable for a value that doesn’t change, such as a number or a string.
For example, if you have server names or region names that never change, then you might want to create them as custom variables rather than query variables. Because they don’t change, you might use them in chained variables rather than other query variables. That would reduce the number of queries Grafana must send when chained variables are updated.
Configure the following options:
Click Run query to test the variable.
In the Preview of values section, Grafana displays a list of the current variable values. If you’ve entered a JSON array, the preview is a table that includes all the value properties. Review them to ensure they match what you expect.
Click Save in the top-right corner.
Enter an optional description of your changes and click Save.
Click Back to list to add or edit other variables, or Back to dashboard and then Exit edit.
Add a text box variable
Text box variables display a free text input field with an optional default value. This is the most flexible variable, because you can enter any value. Use this type of variable if you have metrics with high cardinality or if you want to update multiple panels in a dashboard at the same time.
For more information about cardinality, refer to What are cardinality spikes and why do they matter?
(Optional) Under the Text options section of the page, in the Default value field, enter the default value for the variable.
If you do not enter anything in this field, then Grafana displays an empty text box for users to type text into.
Click Save in the top-right corner.
Enter an optional description of your changes and click Save.
Click Back to list to add or edit other variables, or Back to dashboard and then Exit edit.
Add a constant variable
Constant variables enable you to define a hidden constant. This is useful for metric path prefixes for dashboards you want to share. When you export a dashboard, constant variables are converted to import options.
Constant variables are not flexible. Each constant variable only holds one value, and it cannot be updated unless you update the variable settings.
Constant variables are useful when you have complex values that you need to include in queries but don’t want to retype in every query. For example, if you had a server path called i-0b6a61efe2ab843gg, then you could replace it with a variable called $path_gg.
Under the Constant options section of the page, in the Value field, enter the variable value.
You can enter letters, numbers, and symbols. You can even use wildcards if you use raw format.
Click Save in the top-right corner.
Enter an optional description of your changes and click Save.
Click Back to list to add or edit other variables, or Back to dashboard and then Exit edit.
Add a data source variable
Data source variables enable you to quickly change the data source for an entire dashboard. They are useful if you have multiple instances of a data source, perhaps in different environments.
Configure the following options:
Click Run query to test the variable.
In the Preview of values section, Grafana displays a list of the current variable values. Review them to ensure they match what you expect.
Click Save in the top-right corner.
Enter an optional description of your changes and click Save.
Click Back to list to add or edit other variables, or Back to dashboard and then Exit edit.
Add an interval variable
Use an interval variable to represents time spans such as 1m,1h, 1d. You can think of them as a dashboard-wide “group by time” command. Interval variables change how the data is grouped in the visualization. You can also use the Auto Option to return a set number of data points per time span.
You can use an interval variable as a parameter to group by time (for InfluxDB), date histogram interval (for Elasticsearch), or as a summarize function parameter (for Graphite).
Configure the following options:
Click Run query to test the variable.
In the Preview of values section, Grafana displays a list of the current variable values. Review them to ensure they match what you expect.
Click Save in the top-right corner.
Enter an optional description of your changes and click Save.
Click Back to list to add or edit other variables, or Back to dashboard and then Exit edit.
Interval variable examples
The following example shows a template variable myinterval in a Graphite function:
summarize($myinterval, sum, false)The following example shows a more complex Graphite example, from the Graphite Template Nested Requests panel:
groupByNode(summarize(movingAverage(apps.$app.$server.counters.requests.count, 5), '$interval', 'sum', false), 2, 'sum')Add filters
Note
In Grafana v13, we released the Filter and Group by feature in public preview. It renames the Filters variable (formerly ad hoc filter) and extends it by adding grouping for Prometheus and Loki data sources. However, in the dashboard schema, it’s still referred to as
"kind": "AdhocVariable".To use this feature, enable the
dashboardUnifiedDrilldownControlsfeature toggle in your Grafana configuration file.For more information on the Filter and Group by feature, refer to the Dashboard controls documentation.
Filters are one of the most complex and flexible variable options available. Instead of creating a variable for each dimension by which you want to filter, filters automatically create variables (key/value pairs) for all the dimensions returned by your data source query. This allows you to apply filters dashboard-wide.
Filters let you add label/value filters that are automatically added to all metric queries that use the specified data source. Unlike other variables, you don’t use filters in queries. Instead, you use filters to write filters for existing queries.
The following data sources support filters:
- Dashboard - Use this special data source to apply filters to data from unsupported data sources.
- Prometheus
- Loki
- InfluxDB
- Elasticsearch
- OpenSearch
To create a filter, follow these steps:
Under the Filter options section of the page, select a target data source in the Data source drop-down list.
You can also click Open advanced data source picker to see more options, including adding a data source (Admins only). For more information about data sources, refer to Add a data source.
(Optional) To provide the filter dimensions as comma-separated values (CSV), toggle the Use static key dimensions switch on, and then enter the values in the space provided.
Click Save in the top-right corner.
Enter an optional description of your changes and click Save.
Click Back to dashboard and then Exit edit.
Now you can filter data on the dashboard.
Tip
You can use data links to link back to the dashboard you are currently on. This enables “panel-to-panel filtering,” where clicking a data point in one panel updates the dashboard variables and filters the rest of the dashboard.
To preserve the context of the current dashboard:
- Time range: You must explicitly include the current time range in the link.
- Variables: You must enable Include all variables to preserve existing selections.
- Ordering: Ensure that Include all variables is placed before the specific variable you are defining in the link.
Filters on the current dashboard are automatically preserved.
Learn more in:
Filter any data using the Dashboard data source
In cases where a data source doesn’t support the use of filters, you can use the Dashboard data source to reference that data, and then filter it in a new panel. This allows you to bypass the limitations of the data source in the source panel.
To use filters on data from an unsupported data source, follow these steps:
Navigate to the dashboard with the panel with the data you want to filter.
Click Edit in top-right corner of the dashboard.
Click the Add new element icon and click or drag a panel onto the dashboard.
Click Configure visualization.
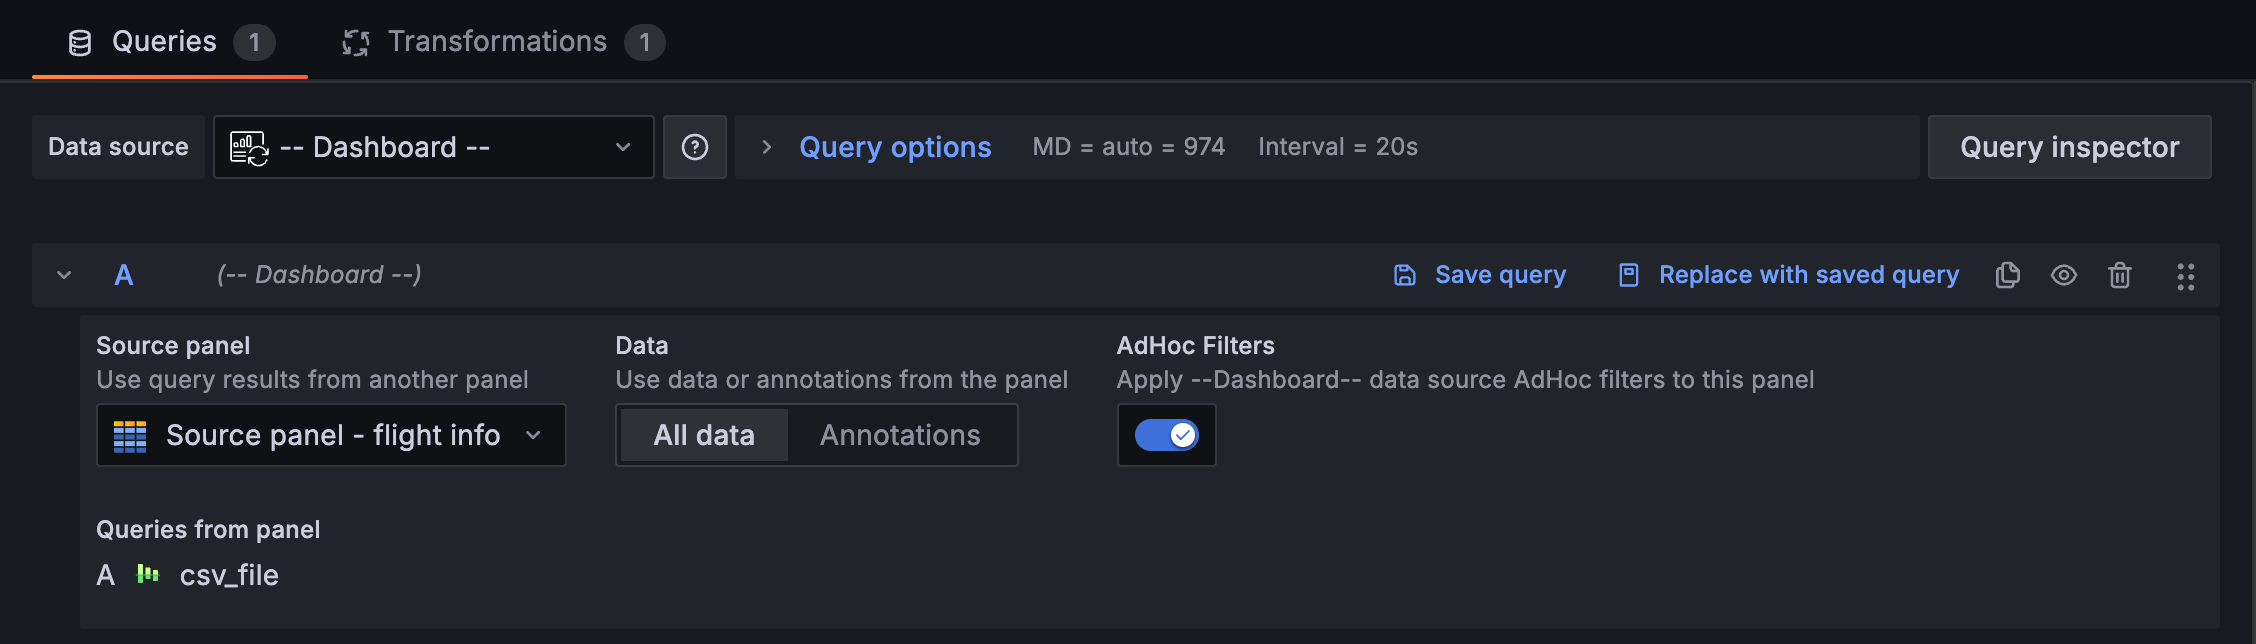
In the Queries tab of the edit panel view, enter
Dashboardin the Data source field and select – Dashboard –.In the query configuration section, make the following selections:
- Source panel - Choose the panel with the source data.
- Data - Select All Data to use the data of the panel, and not just the annotations. This is the default selection.
- Filters - Toggle on the switch to make the data from the referenced panel filterable.
Note
If you’re referencing multiple panels in a dashboard with the Dashboard data source, you can only use one of those source panels at a time for filtering.
Configure any other needed options for the panel.
Click Save in the top-right corner.
Enter an optional description of your changes and click Save.
Click Back to list to add or edit other variables, or Back to dashboard and then Exit edit.
Now you can filter the data from the source panel by way of the Dashboard data source. Add as many panels as you need.
Dashboard drilldown with filters
In table and bar chart visualizations, you can apply filters directly from the visualization. To quickly apply filter variables, follow these steps:
To display the filter icons, hover your cursor over the table cell with the value for which you want to filter. In this example, the cell value is
ConfigMap Updated, which is in thealertnamecolumn:![Table and bar chart with a filter icon displayed on a table cell]()
In bar chart visualizations, hover and click the bar to display the filter button:
![The filter button in a bar chart tooltip]()
Click the add filter icon.
The variable pair
alertname = ConfigMap Updatedis added to the filter and all panels using the same data source that include that variable value are filtered by that value:![Table and bar chart, filtered]()
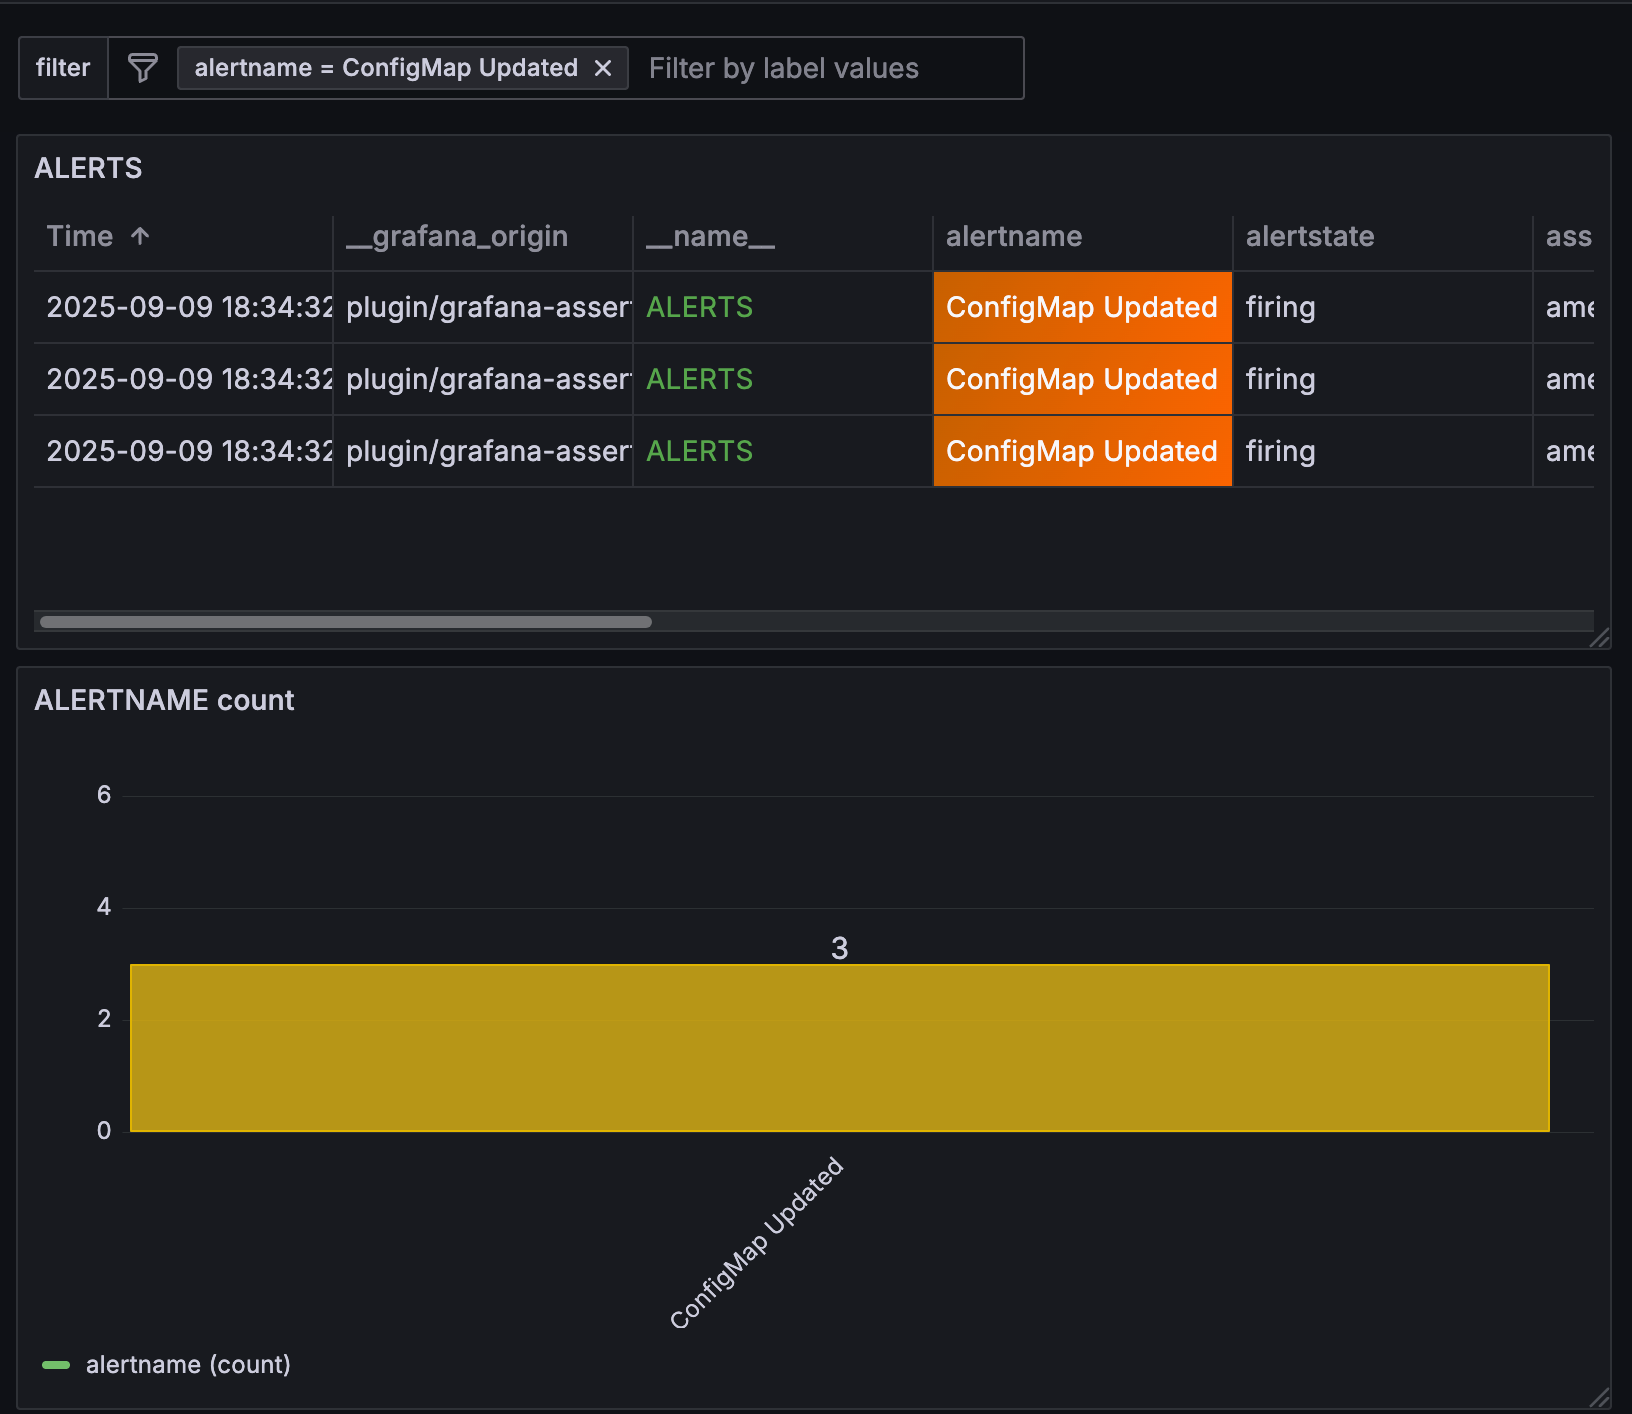
If one of the panels in the dashboard using that data source doesn’t include that variable value, the panel won’t return any data. In this example, the variable pair _name_ = ALERTS has been added to the filter so the bar chart doesn’t return any results:

In cases where the data source you’re using doesn’t support filtering, consider using the special Dashboard data source. For more information, refer to Filter any data using the Dashboard data source.
Add a switch variable
Switch variables display a switch with two configurable values representing enabled and disabled states. This variable type is useful when you need to:
- Toggle between different query conditions
- Enable or disable specific filters
- Switch between different visualization modes
- Control boolean parameters in your data sources
Configure the following options:
Click Save dashboard.
Click Back to list to add or edit other variables, or Back to dashboard and then Exit edit.
Switch variable examples
The following example shows a switch variable $debug_mode used in a Prometheus query to conditionally include debug labels:
up{job="my-service"} and ($debug_mode == "true" or on() vector(0))The following example shows a switch variable $show_errors used to filter log entries:
{job="application"} |= ($show_errors == "1" ? "ERROR" : "")You can also use switch variables in panel titles and other dashboard elements:
{{#if debug_mode}}Debug Mode: {{/if}}Application MetricsVariable selection options
Selection Options are a feature you can use to manage variable option selections for query and custom variables. All selection options are optional, and they are off by default.
Multi-value variables
Interpolating a variable with multiple values selected is tricky as it’s not straight forward how to format the multiple values into a string that’s valid in the given context where the variable is used. Grafana tries to solve this by allowing each data source plugin to inform the templating interpolation engine what format to use for multiple values.
Note
The Custom all value option on the variable must be blank for Grafana to format all values into a single string. If it’s left blank, then Grafana concatenates (adds together) all the values in the query. Something like
value1,value2,value3. If a customallvalue is used, then instead the value is something like*orall.
Multi-value variables with a Graphite data source
Graphite uses glob expressions. A variable with multiple values would, in this case, be interpolated as {host1,host2,host3} if the current variable value was host1, host2, and host3.
Multi-value variables with a Prometheus or InfluxDB data source
InfluxDB and Prometheus use regular expressions, so the same variable would be interpolated as (host1|host2|host3). Every value would also be regular expression escaped. If not, a value with a regular expression control character would break the regular expression.
Multi-value variables with an Elastic data source
Elasticsearch uses Lucene query syntax, so the same variable would be formatted as ("host1" OR "host2" OR "host3"). In this case, every value must be escaped so that the value only contains Lucene control words and quotation marks.
Variable indexing
If you have a multi-value variable that’s formatted as an array, you can use array positions to reference the values rather than the actual values. You can use this functionality in dashboard panels to filter data, and when you do so, the array is maintained.
To reference variable values this way, use the following syntax:
${query0.0}The preceding syntax references the first, or 0, position in the array.
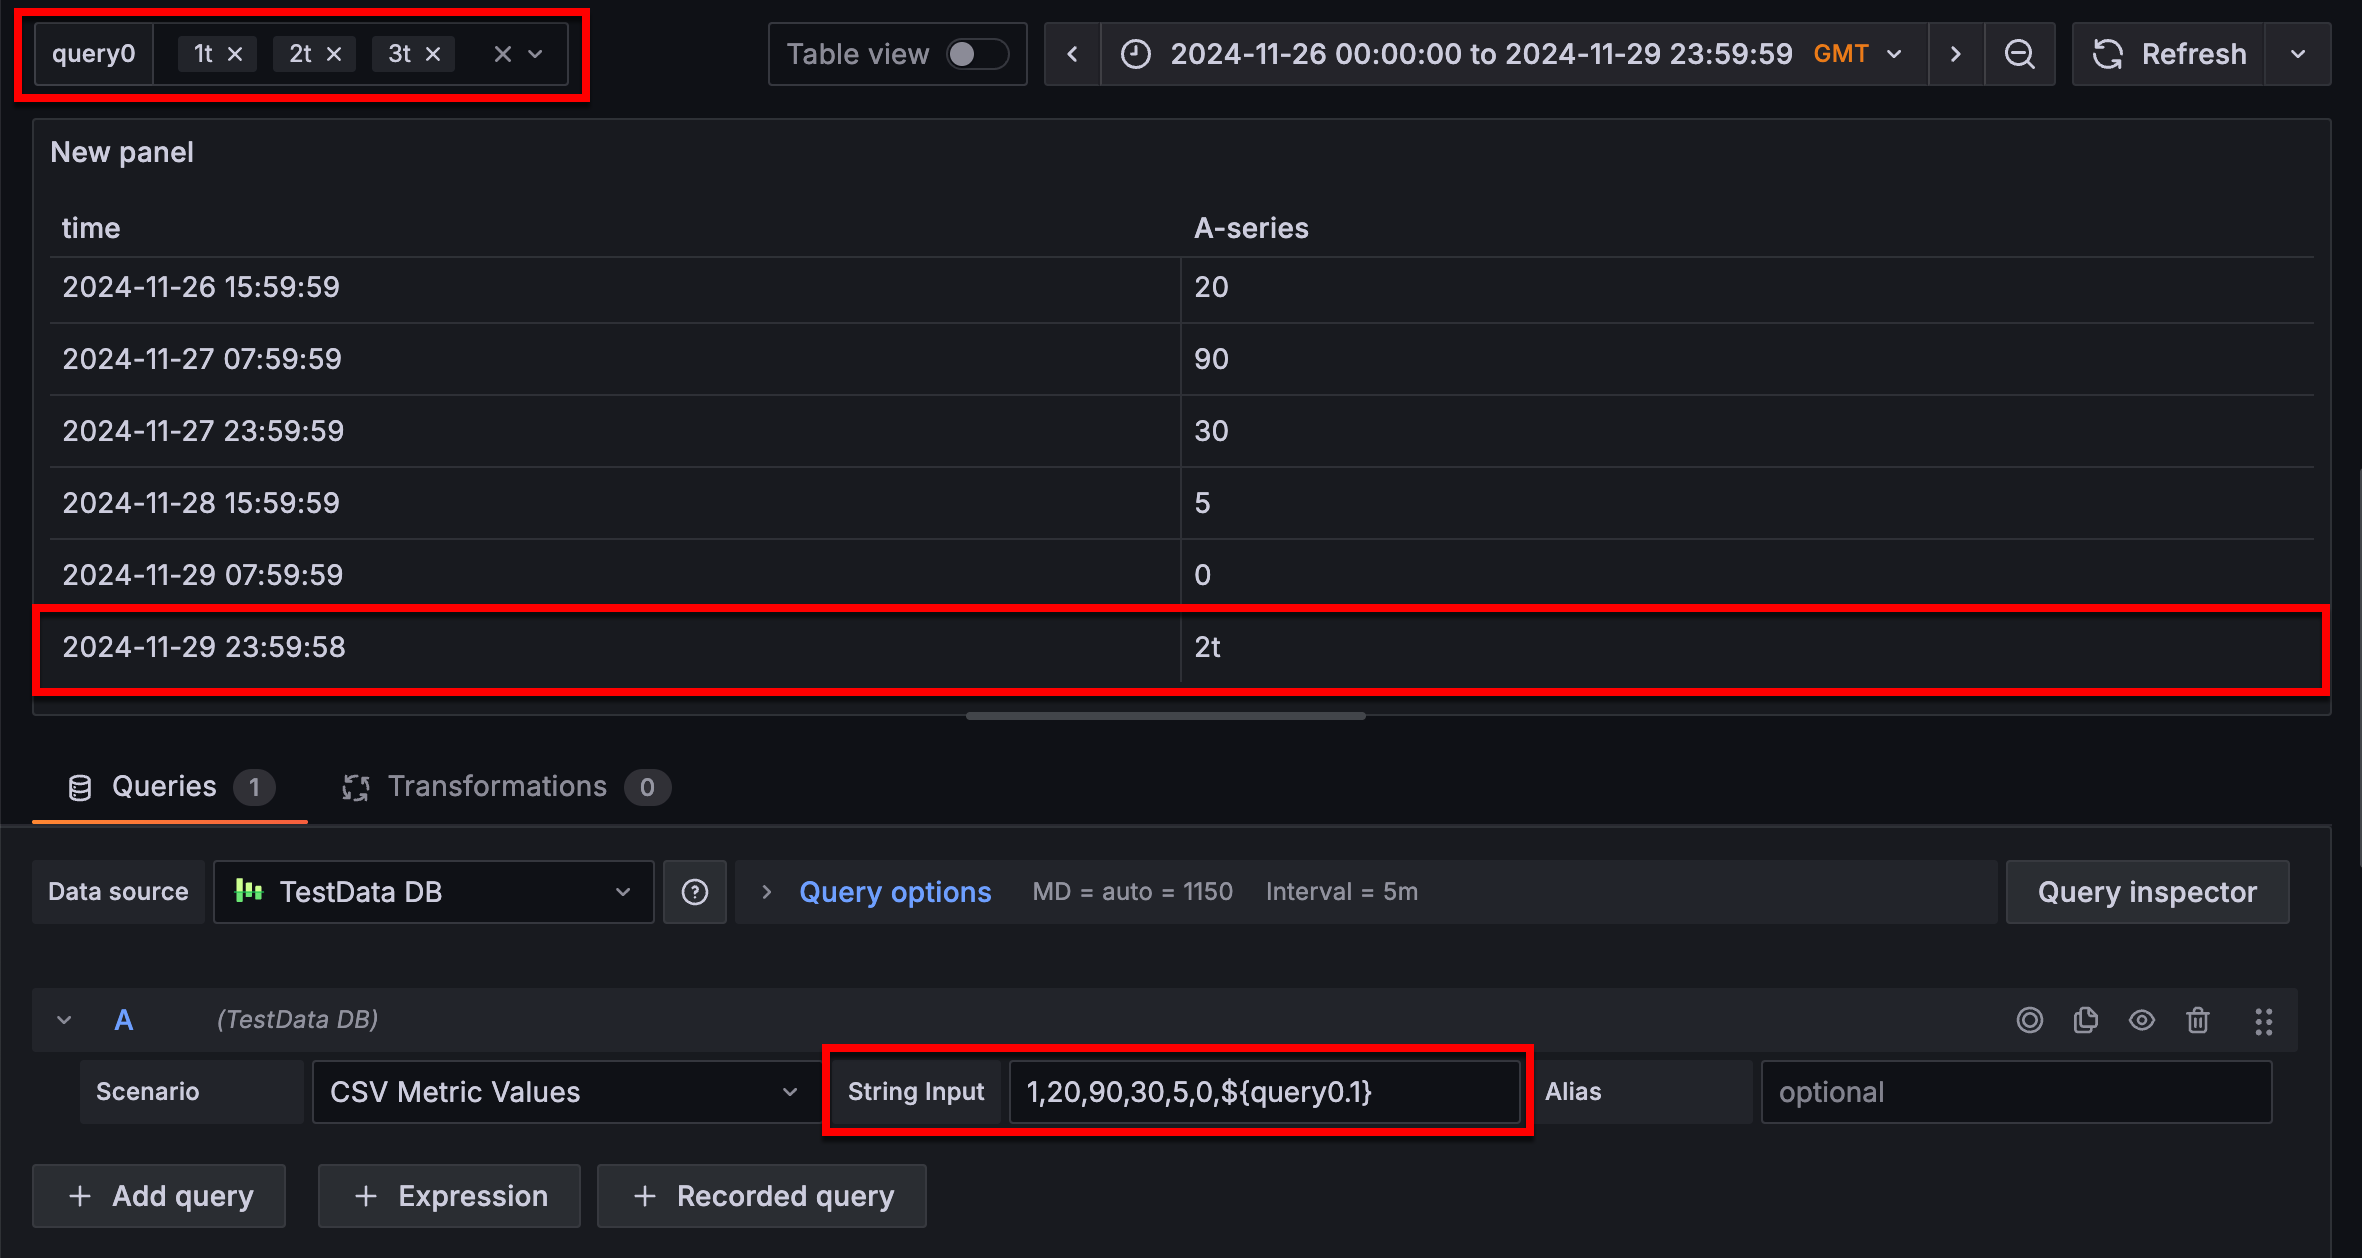
In the following example, there’s an array of three values, 1t, 2t, and 3t, and rather than referencing those values, the panel query references the second value in the array using the syntax ${query0.1}:
Troubleshoot multi-value variables
Automatic escaping and formatting can cause problems and it can be tricky to grasp the logic behind it. Especially for InfluxDB and Prometheus where the use of regular expression syntax requires that the variable is used in regular expression operator context.
If you do not want Grafana to do this automatic regular expression escaping and formatting, then you must do one of the following:
- Turn off the Multi-value or Include All option options.
- Use the raw variable format.
Custom all value
This option is only visible if the Include All option is selected.
Enter regular expressions, globs, or Lucene syntax in the Custom all value field to define the value of the All option.
By default the All value includes all options in combined expression. This can become very long and can have performance problems. Sometimes it can be better to specify a custom all value, like a wildcard regular expression.
In order to have custom regular expression, globs, or Lucene syntax in the Custom all value option, it’s never escaped so you have to think about what’s a valid value for your data source.
Include All option
Grafana adds an All option to the variable drop-down list. If a user selects this option, then all variable options are selected.


