
This is documentation for the next version of Grafana documentation. For the latest stable release, go to the latest version.
About metrics and telemetry
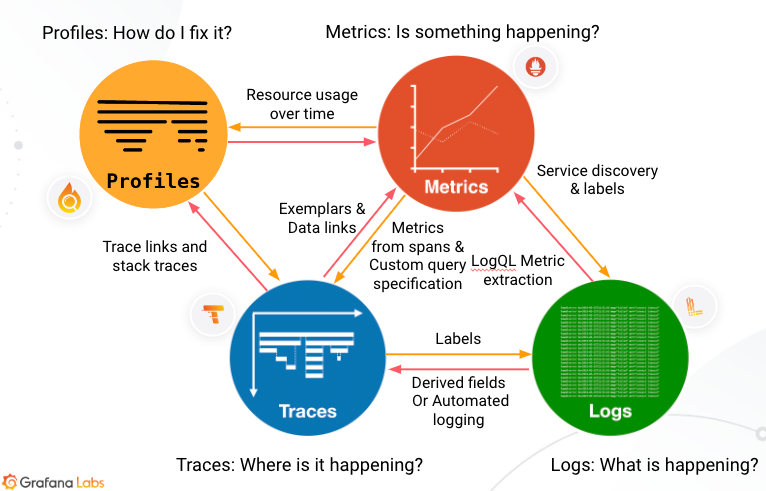
Metrics, logs, traces, and profiles form the pillars of observability. Correlating the four pillars of observability helps create a holistic view of your application and infrastructure.
Telemetry signals
Metrics
Metrics provide a high-level picture of a system’s state. They are the foundation of alerts because you can compare them against known thresholds. Alerts run continuously and trigger when values move outside expected ranges. Metrics often provide the first signal that something changed.
Logs
Logs provide an audit trail of activity from individual processes that adds context. Logs are atomic events that describe what is happening in your application’s services. While metrics are quantitative (numeric) and structured, logs are qualitative (textual) and unstructured or semi-structured. Logs provide more detail, but they can also create much higher data volumes. Logs let you know what’s happening to your application.
Traces
Traces add detail to the observability picture by showing what happens at each step in a request path. A trace shows where requests start and finish and how long each step takes to complete. For example, a trace can show how long an HTTP request, a database lookup, or a call to a third-party service takes. This data helps you locate problem areas and understand their impact.
Profiles
Profiles help you understand how your applications utilize compute resources such as CPU time and memory. This helps you identify specific lines of code or functions to optimize and improve performance and efficiency.
Why use metrics?
Metrics tell you how much of something exists, such as how much memory a computer has available. In Grafana, metrics are most useful when you record them repeatedly over time. This lets you compare how changes, such as running a program, affect available system resources.
Metrics like these are stored in a time series database (TSDB), like Prometheus, by recording a metric and pairing that entry with a time stamp. Each TSDB uses a slightly different data model, but all combine these two aspects. Grafana and Grafana Cloud can accept their different metrics formats for visualization.
For example, you might be interested in comparing system I/O performance as the number of users increases during a morning while many users in a company come online to start their work days.
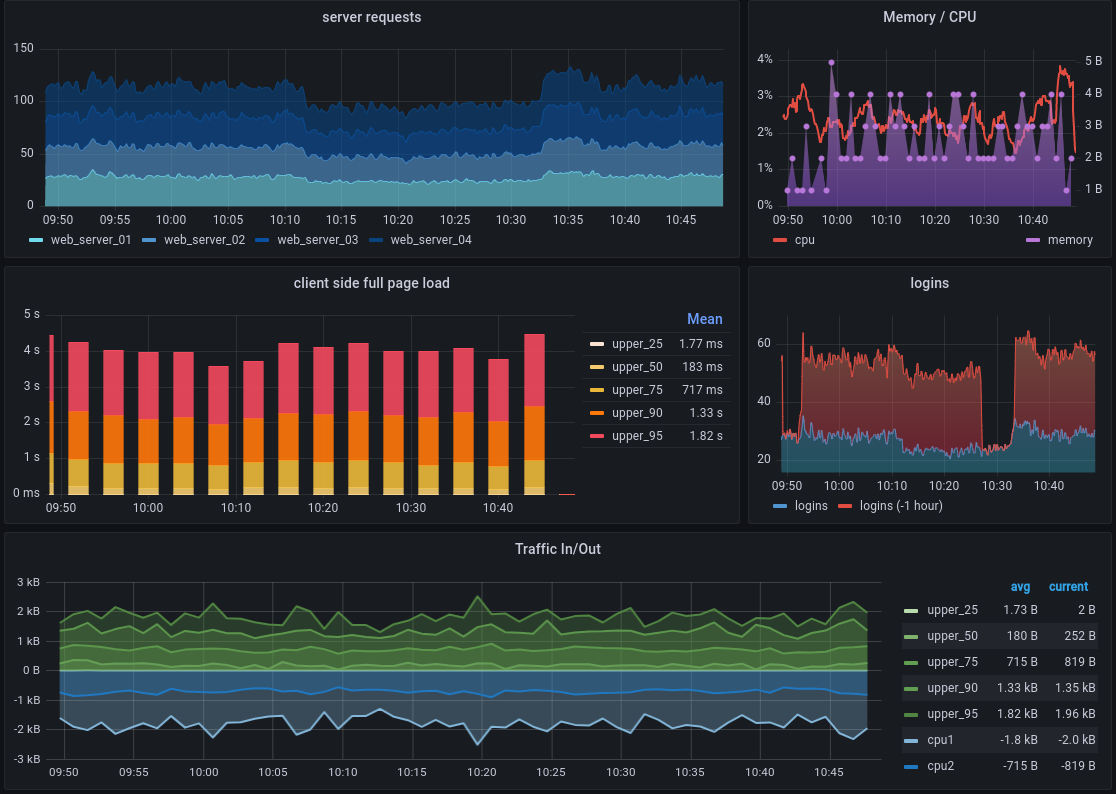
A chart showing resource use over time is an example of a visualization. Comparing time-stamped metrics in visualizations helps you spot system changes as they happen.
Grafana and Grafana Cloud offer a variety of visualizations to suit different use cases. For more information, refer to the Grafana documentation on visualizations.
Use metrics with other telemetry data
If you also have other telemetry data, like logs or traces, you can use the telemetry signals together.
Refer to Use signals together to learn about using metrics with other telemetry data and why correlation matters.


