
Important: This documentation is about an older version. It's relevant only to the release noted, many of the features and functions have been updated or replaced. Please view the current version.
Drill down your metrics
Drill down into your metrics to gain insight into your data without writing a query. First, filter the metrics that Metrics Drilldown surfaces. Then, select a metric to perform in-depth analysis.
Filter metrics in Metrics Drilldown
To begin drilling down your data, filter the metrics that appear in Metrics Drilldown.
Navigate to the Metrics Drilldown page in Grafana. Refer to Get started with Grafana Metrics Drilldown.
From the Data source dropdown, select a data source to view related metrics. Supported data sources include Prometheus and Prometheus-compatible data sources.
(Optional) Select a label name from the Filter by label values dropdown. Then, follow the prompts to complete your filter criteria.
Note
You can apply multiple filters to your metrics. If you don’t see a metric you expect, refer to Troubleshoot missing metrics.
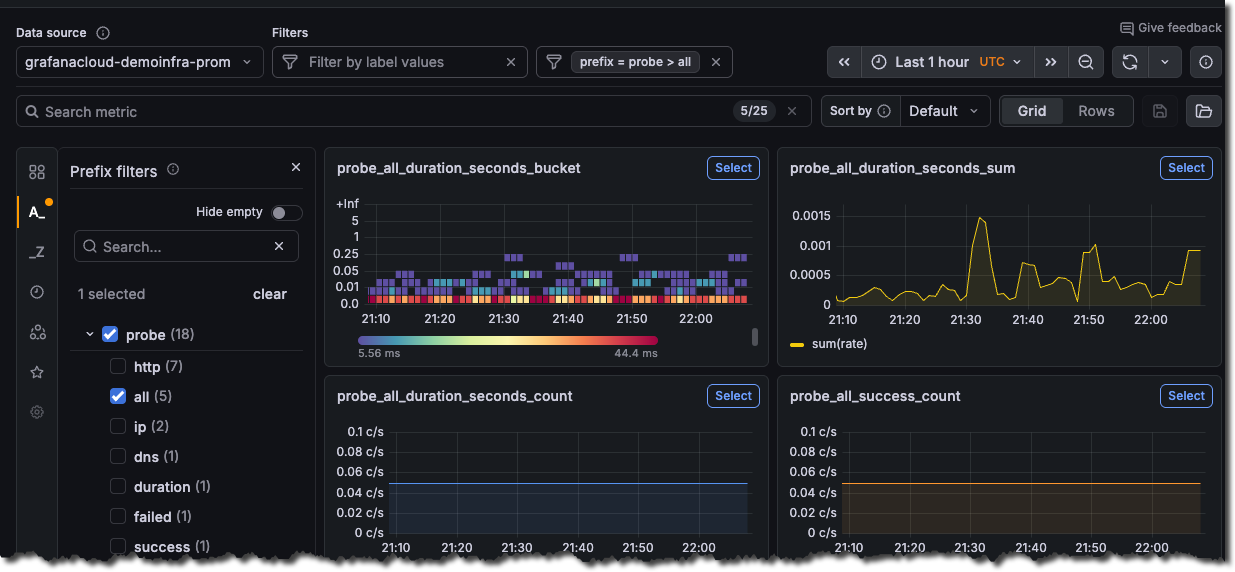
![Grafana Metrics Drilldown with filters and metrics that contain data]()
(Optional) To search for metrics, type keywords in the search bar under Quick search metrics.
(Optional) Select how you want to sort metrics in the app. You can sort metrics alphabetically (A-Z or Z-A), with recently selected metrics first (default), by prevalence in dashboard panel queries, or by prevalence in alerting rules.
Use the time picker to select a date and time range from the dropdown menu, or use an absolute time range.
Select the refresh interval control next to the Refresh icon to set a refresh rate from the dropdown menu. By default, refresh is Off.
Apply advanced filters
Apply advanced filters to further refine the metrics that appear in Metrics Drilldown. Access the following advanced filters from the left-side menu of the Metrics Drilldown app.
Filter logic
Multiple selections for a filter apply “OR” logic, but selections between filters apply “AND” logic.
For example, if you select both envoy and kafka as prefix filters, the app shows all metrics with a prefix of either envoy or kafka.
Then, if you select count as a suffix filter, the app updates to only show metrics with the count suffix.

Analyze selected metrics
After filtering the metrics in Metrics Drilldown, you can investigate the selected metrics.
- From the Metrics Drilldown main page, locate the metric you want to investigate.
- From the upper-right corner of the metric panel, click Select.
A detailed view of the metric opens that shows the following details:
- A Breakdown tab that shows time series visualizations for each of the label-value pairs for the selected metric. To add a label-value pair to your filters, you can drill down on each label and then select Add to filter.
- A Related metrics tab that shows other metrics with similar names and common prefixes. Use it to quickly find metrics that belong to the same area or task without knowing exact metric names.
- A Related logs tab that shows how many related log streams match your metric and lets you continue investigating in logs-focused workflows.
View the metric in Explore
Using the panel menu, you can view the metric in Explore or copy the URL.
To open the visualization in Explore, use the metric panel actions and select Explore.
Share and bookmark metrics
You can share a metric view with others or bookmark it for yourself.
- To share, select Copy URL to copy the current page URL to your clipboard. The URL isn’t saved in the app.
- To bookmark, select Add bookmark to save your current exploration state, including the data source, filters, selected metric, label breakdowns, and time range.
To revisit a bookmark, open the bookmarks list from the left-side menu. Bookmarks are personal and saved per user. If you want to share a specific state with others, use Copy URL instead.
Troubleshoot missing metrics
Some Prometheus metrics may not appear in Metrics Drilldown, even though you can view them in Explore. This happens in high-cardinality environments when the Prometheus data source enforces its default 40,000-metric limit.
To resolve this issue, choose one of the following options:
Increase the metric limit in your Prometheus data source settings.
Caution
Increasing this limit can affect Metrics Drilldown performance.
Use the name filter to focus on a specific metric. For example:
__name__ = vm_http.


