What’s new in Grafana v11.4
Welcome to Grafana 11.4! This is a special release with one new feature, created in partnership with AWS. We’ve made improvements to Cloudwatch so you can query your logs using two additional query languages: Opensearch PPL and Opensearch SQL. We’ve also updated the querying experience by providing a sample of commonly-used queries, syntax highlighting in the query editor, and auto-completion suggestions for complex queries. Read on to learn more about this new feature.
For even more detail about all the changes in this release, refer to the changelog. For the specific steps we recommend when you upgrade to v11.4, check out our Upgrade Guide.
Query Cloudwatch Logs Insights with PPL and SQL
Generally available in all editions of Grafana
The AWS CloudWatch data source plugin now offers two new query languages for searching through logs: OpenSearch PPL and OpenSearch SQL. You now have increased flexibility to choose a more familiar query language and to take advantage of their unique features (like the SQL JOIN command) when querying AWS CloudWatch Logs Insights. In addition to the already supported Logs Insights QL option, you can find the added query language options in the new Query language drop-down list.
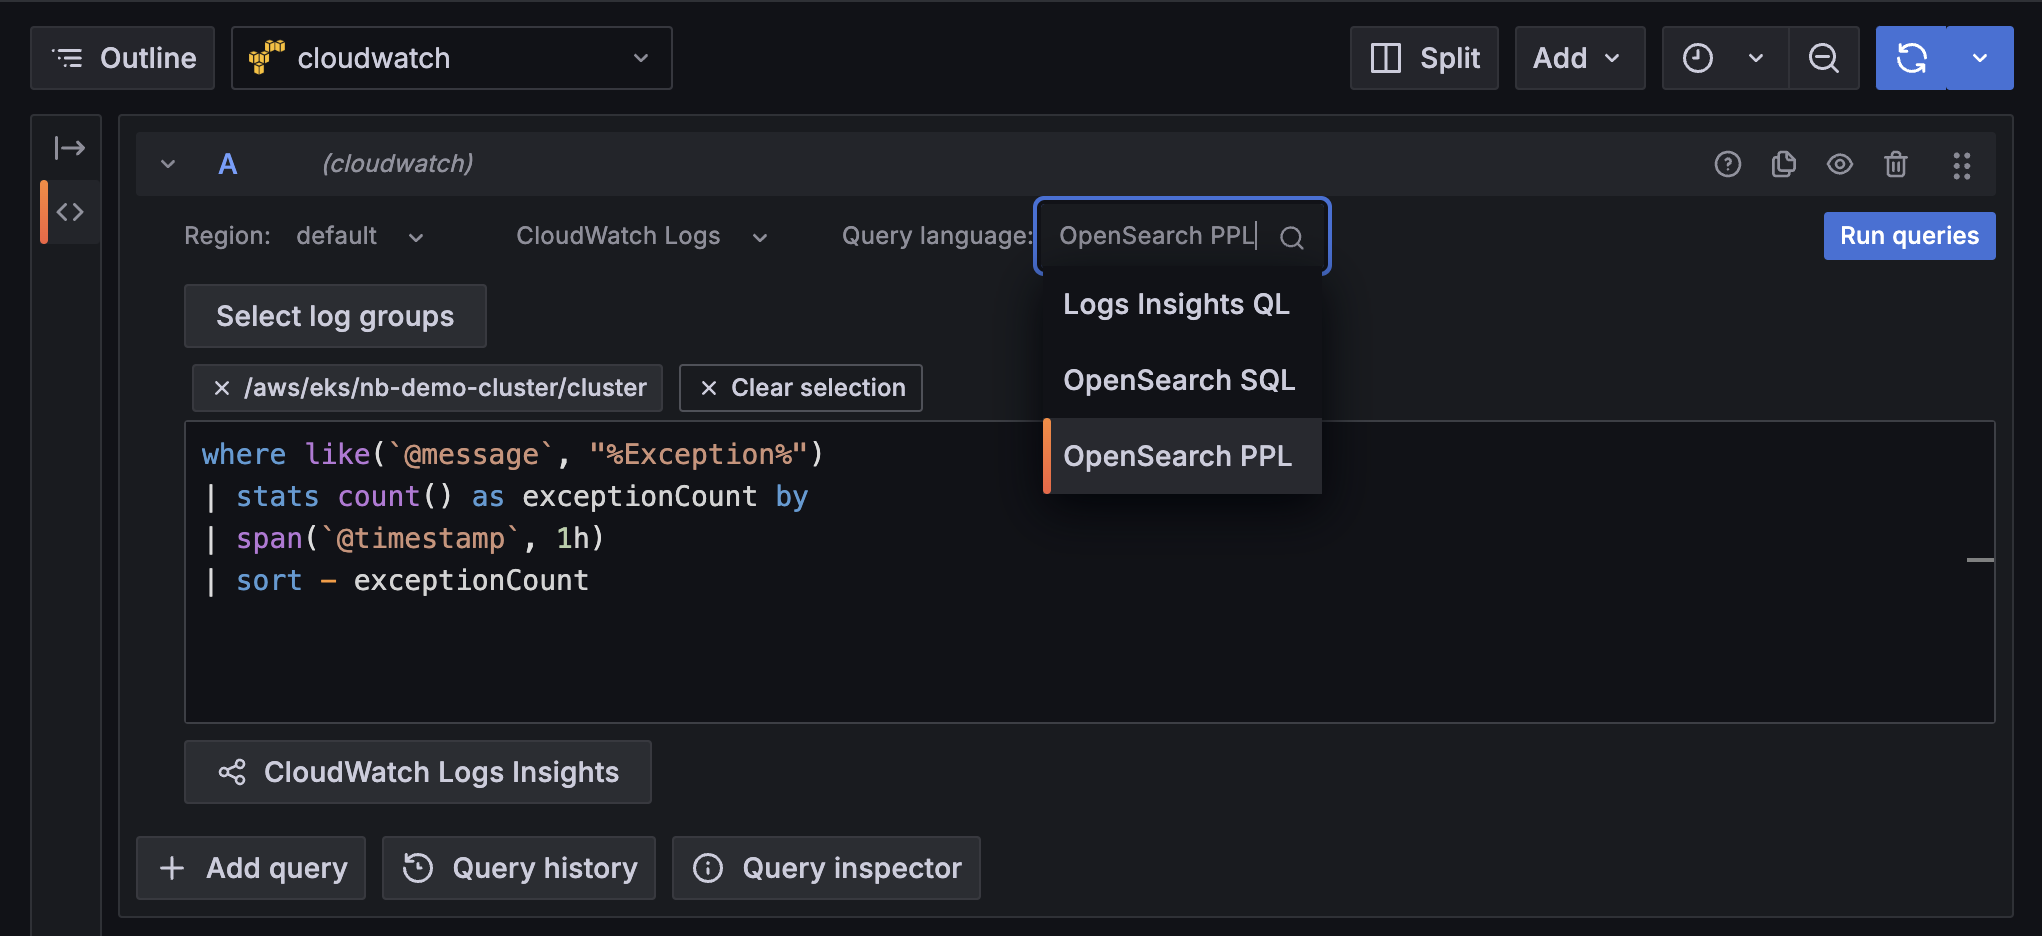
We’ve also updated the query editor to support syntax highlighting and to provide suggestions while you type, which simplifies writing complex queries. When you select log groups, the suggestions also include discovered fields.
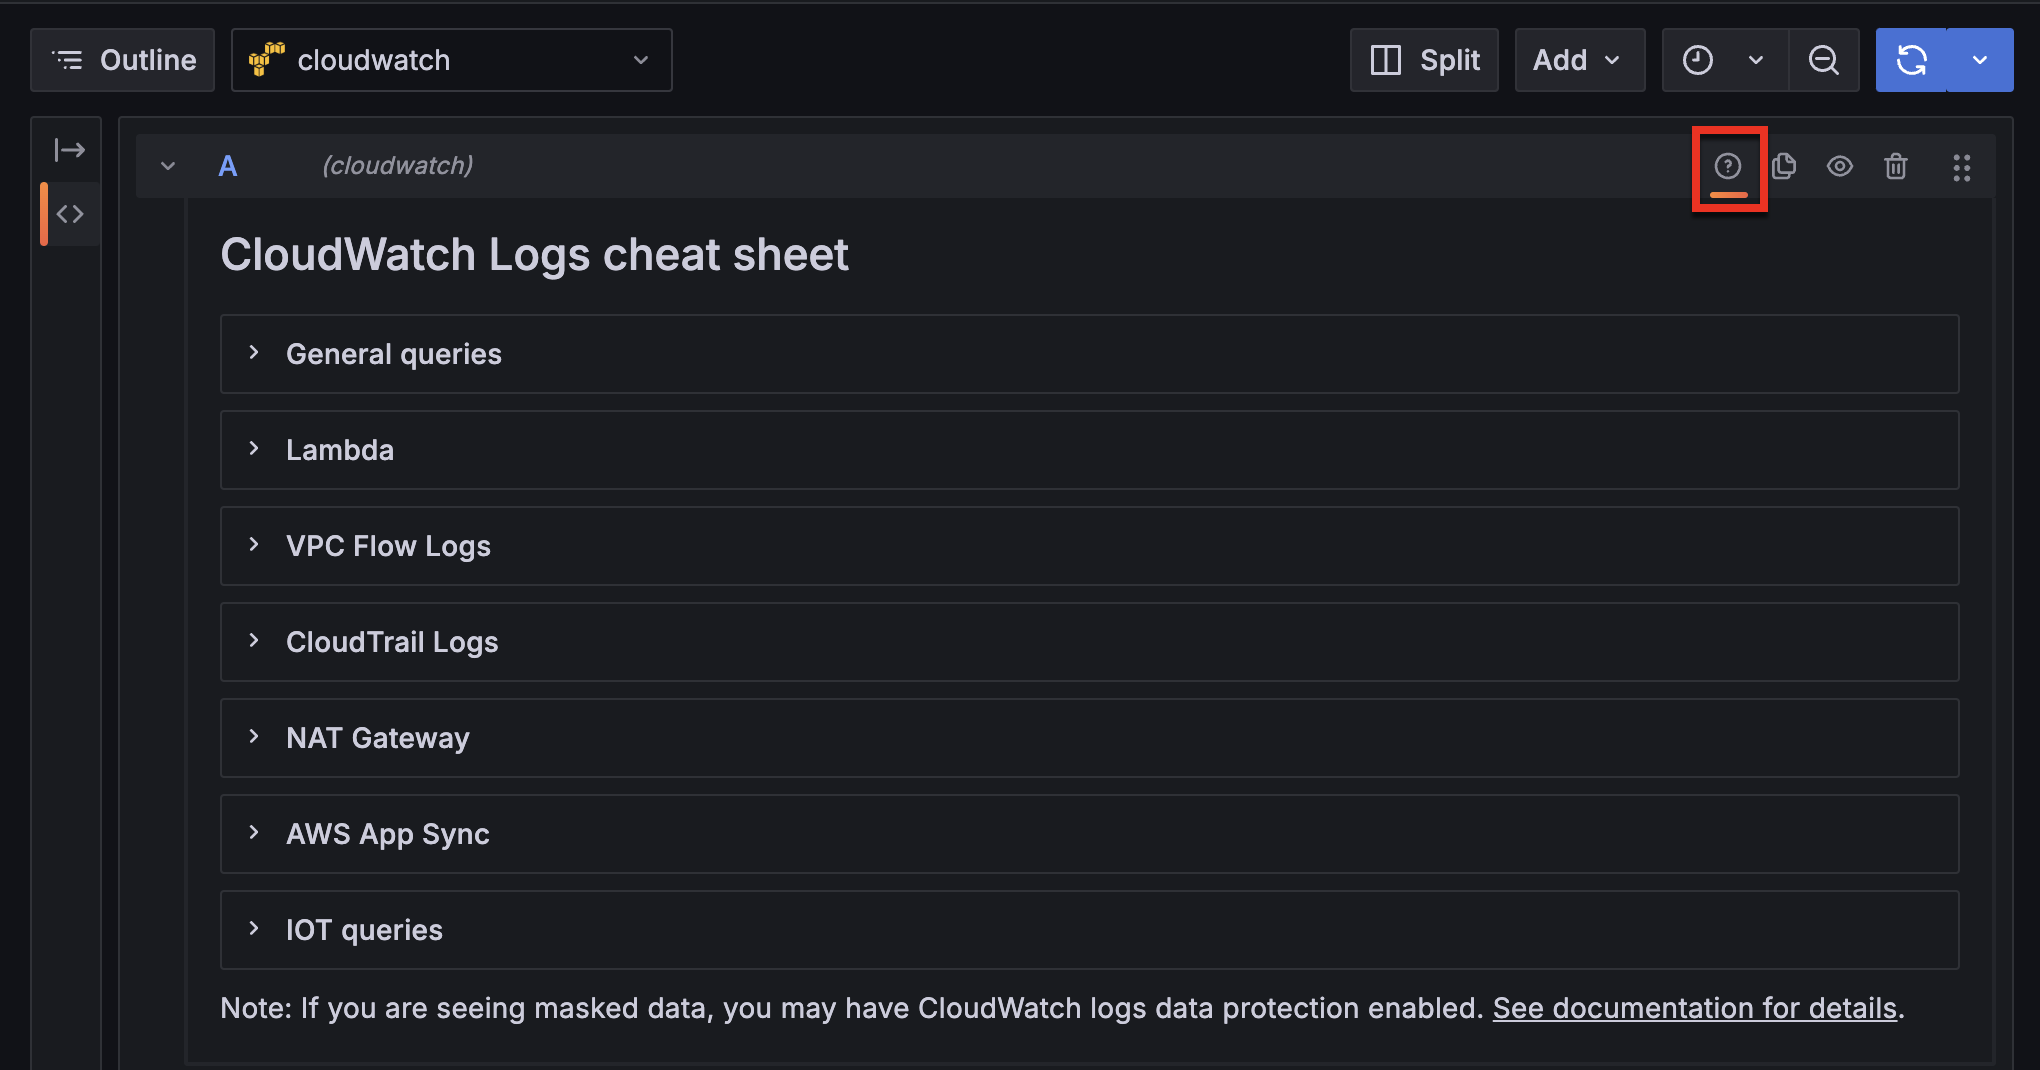
Not sure where to start? We’ve also updated our CloudWatch Logs cheat sheet with the most commonly used queries so you can paste and customize to fit exactly what you need. Clicking on any of the example queries prefills the query input field.
For the complete list of commands supported for OpenSearch PPL and SQL, refer to the Cloudwatch Logs Insights documentation.


