
Verify Prometheus metrics are written to an endpoint
To verify Prometheus metrics are written to an endpoint, complete the following steps:
Log into the machine on which Prometheus is installed.
If required, switch to a user that has administrative privileges.
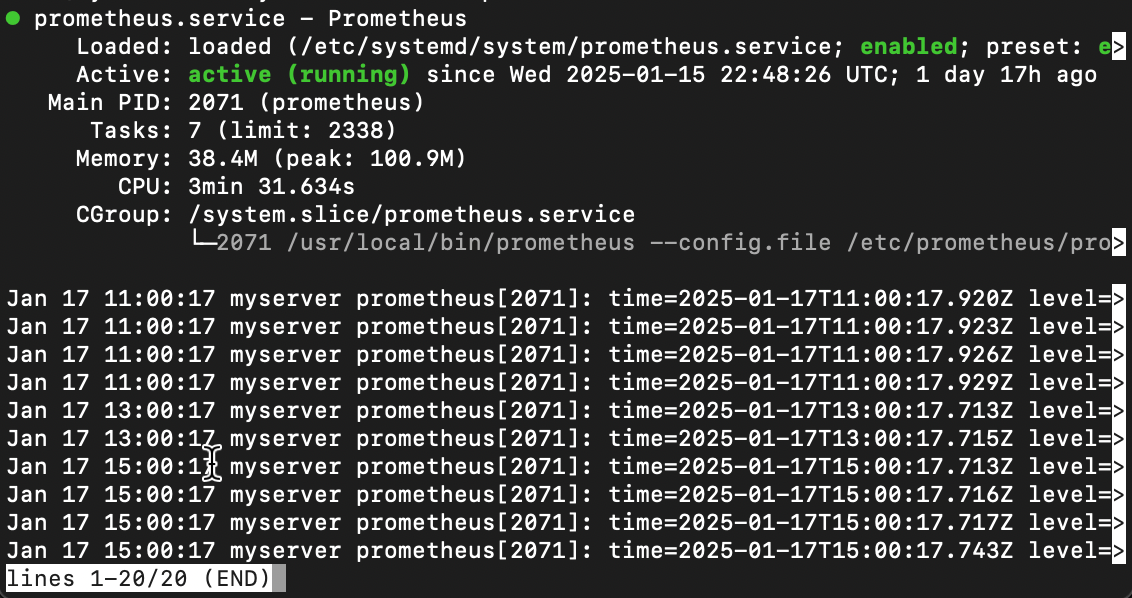
To check the Prometheus service status, run one of the following commands:
For Linux:
systemctl status prometheus.serviceFor Windows:
sc query prometheusYou should see something similar to the following:
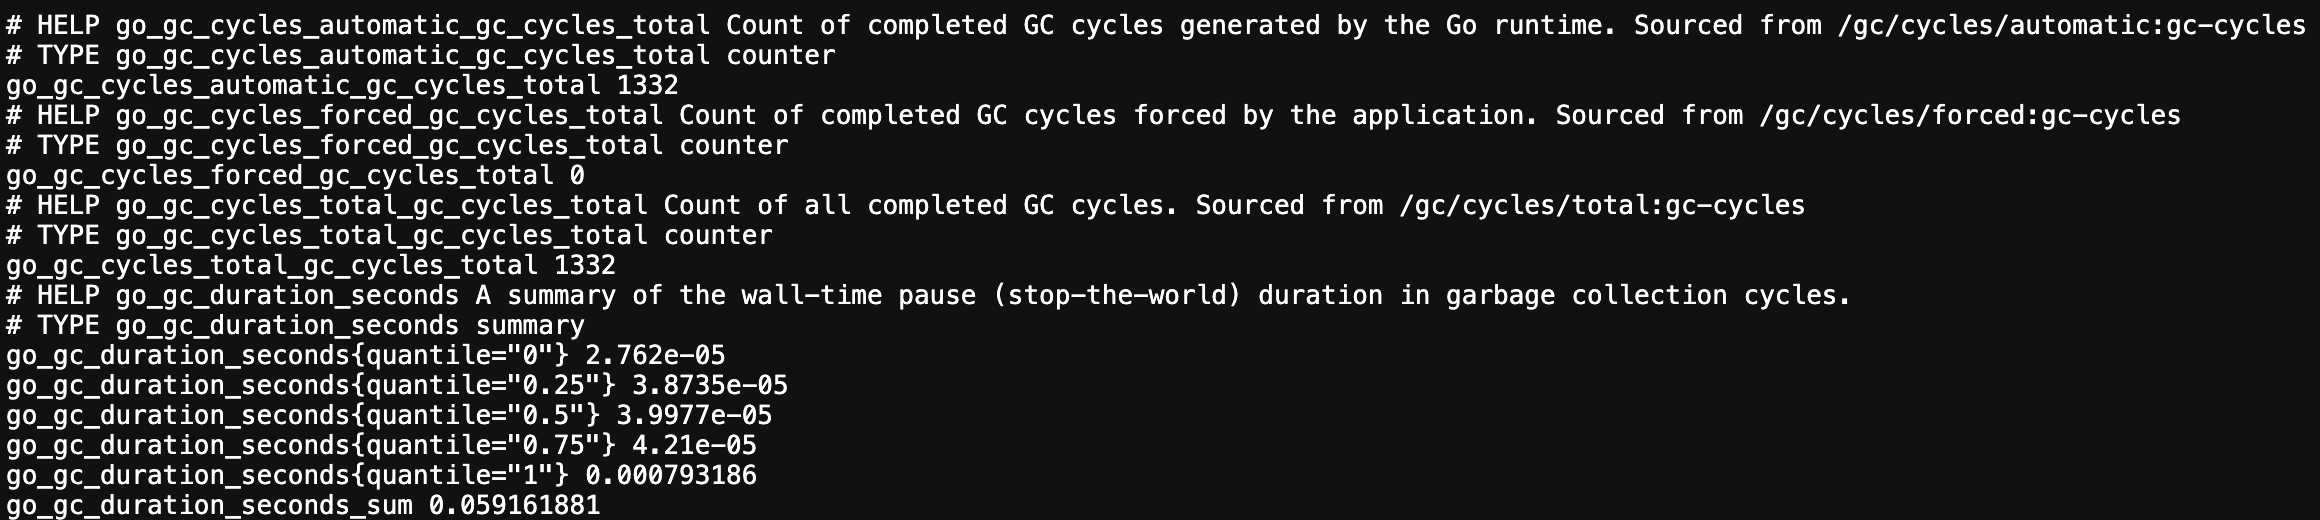
To ensure that Prometheus is capturing the metrics, open a browser tab and navigate to the metrics endpoint URL.
For example, navigate to
http://localhost:9090/metricsYou should see something similar to the following:
Tip: Consult the Prometheus documentation if you are unable to run the Prometheus service or can’t verify that Prometheus is capturing metrics.
Troubleshooting
Explore the following troubleshooting topics if you need help:
- Prometheus is not running as a service
- Prometheus is not running
- Check if Prometheus is capturing metrics
More to explore (optional)
Troubleshooting options
Please tell us what didn't work: