Open in Grafana Cloud
Complete this learning path directly in your Grafana Cloud stack with an interactive learning experience.
Run your first k6 performance test
k6 lets you describe HTTP traffic in code, run it locally, and view results in Grafana Cloud.
In this path, you get to a local k6 run quickly, then send the same script to Grafana Cloud k6 so you can open a stored run and dashboard.
Grafana Cloud users: you can also try the interactive onboarding in the k6 app. Go to Testing & synthetics > Performance to:
- Explore test authoring tools (k6 Studio, OpenAPI to k6)
- Run tests from the UI or CLI
- Understand results
This guide complements the in-product onboarding with step-by-step instructions you can follow at your own pace.
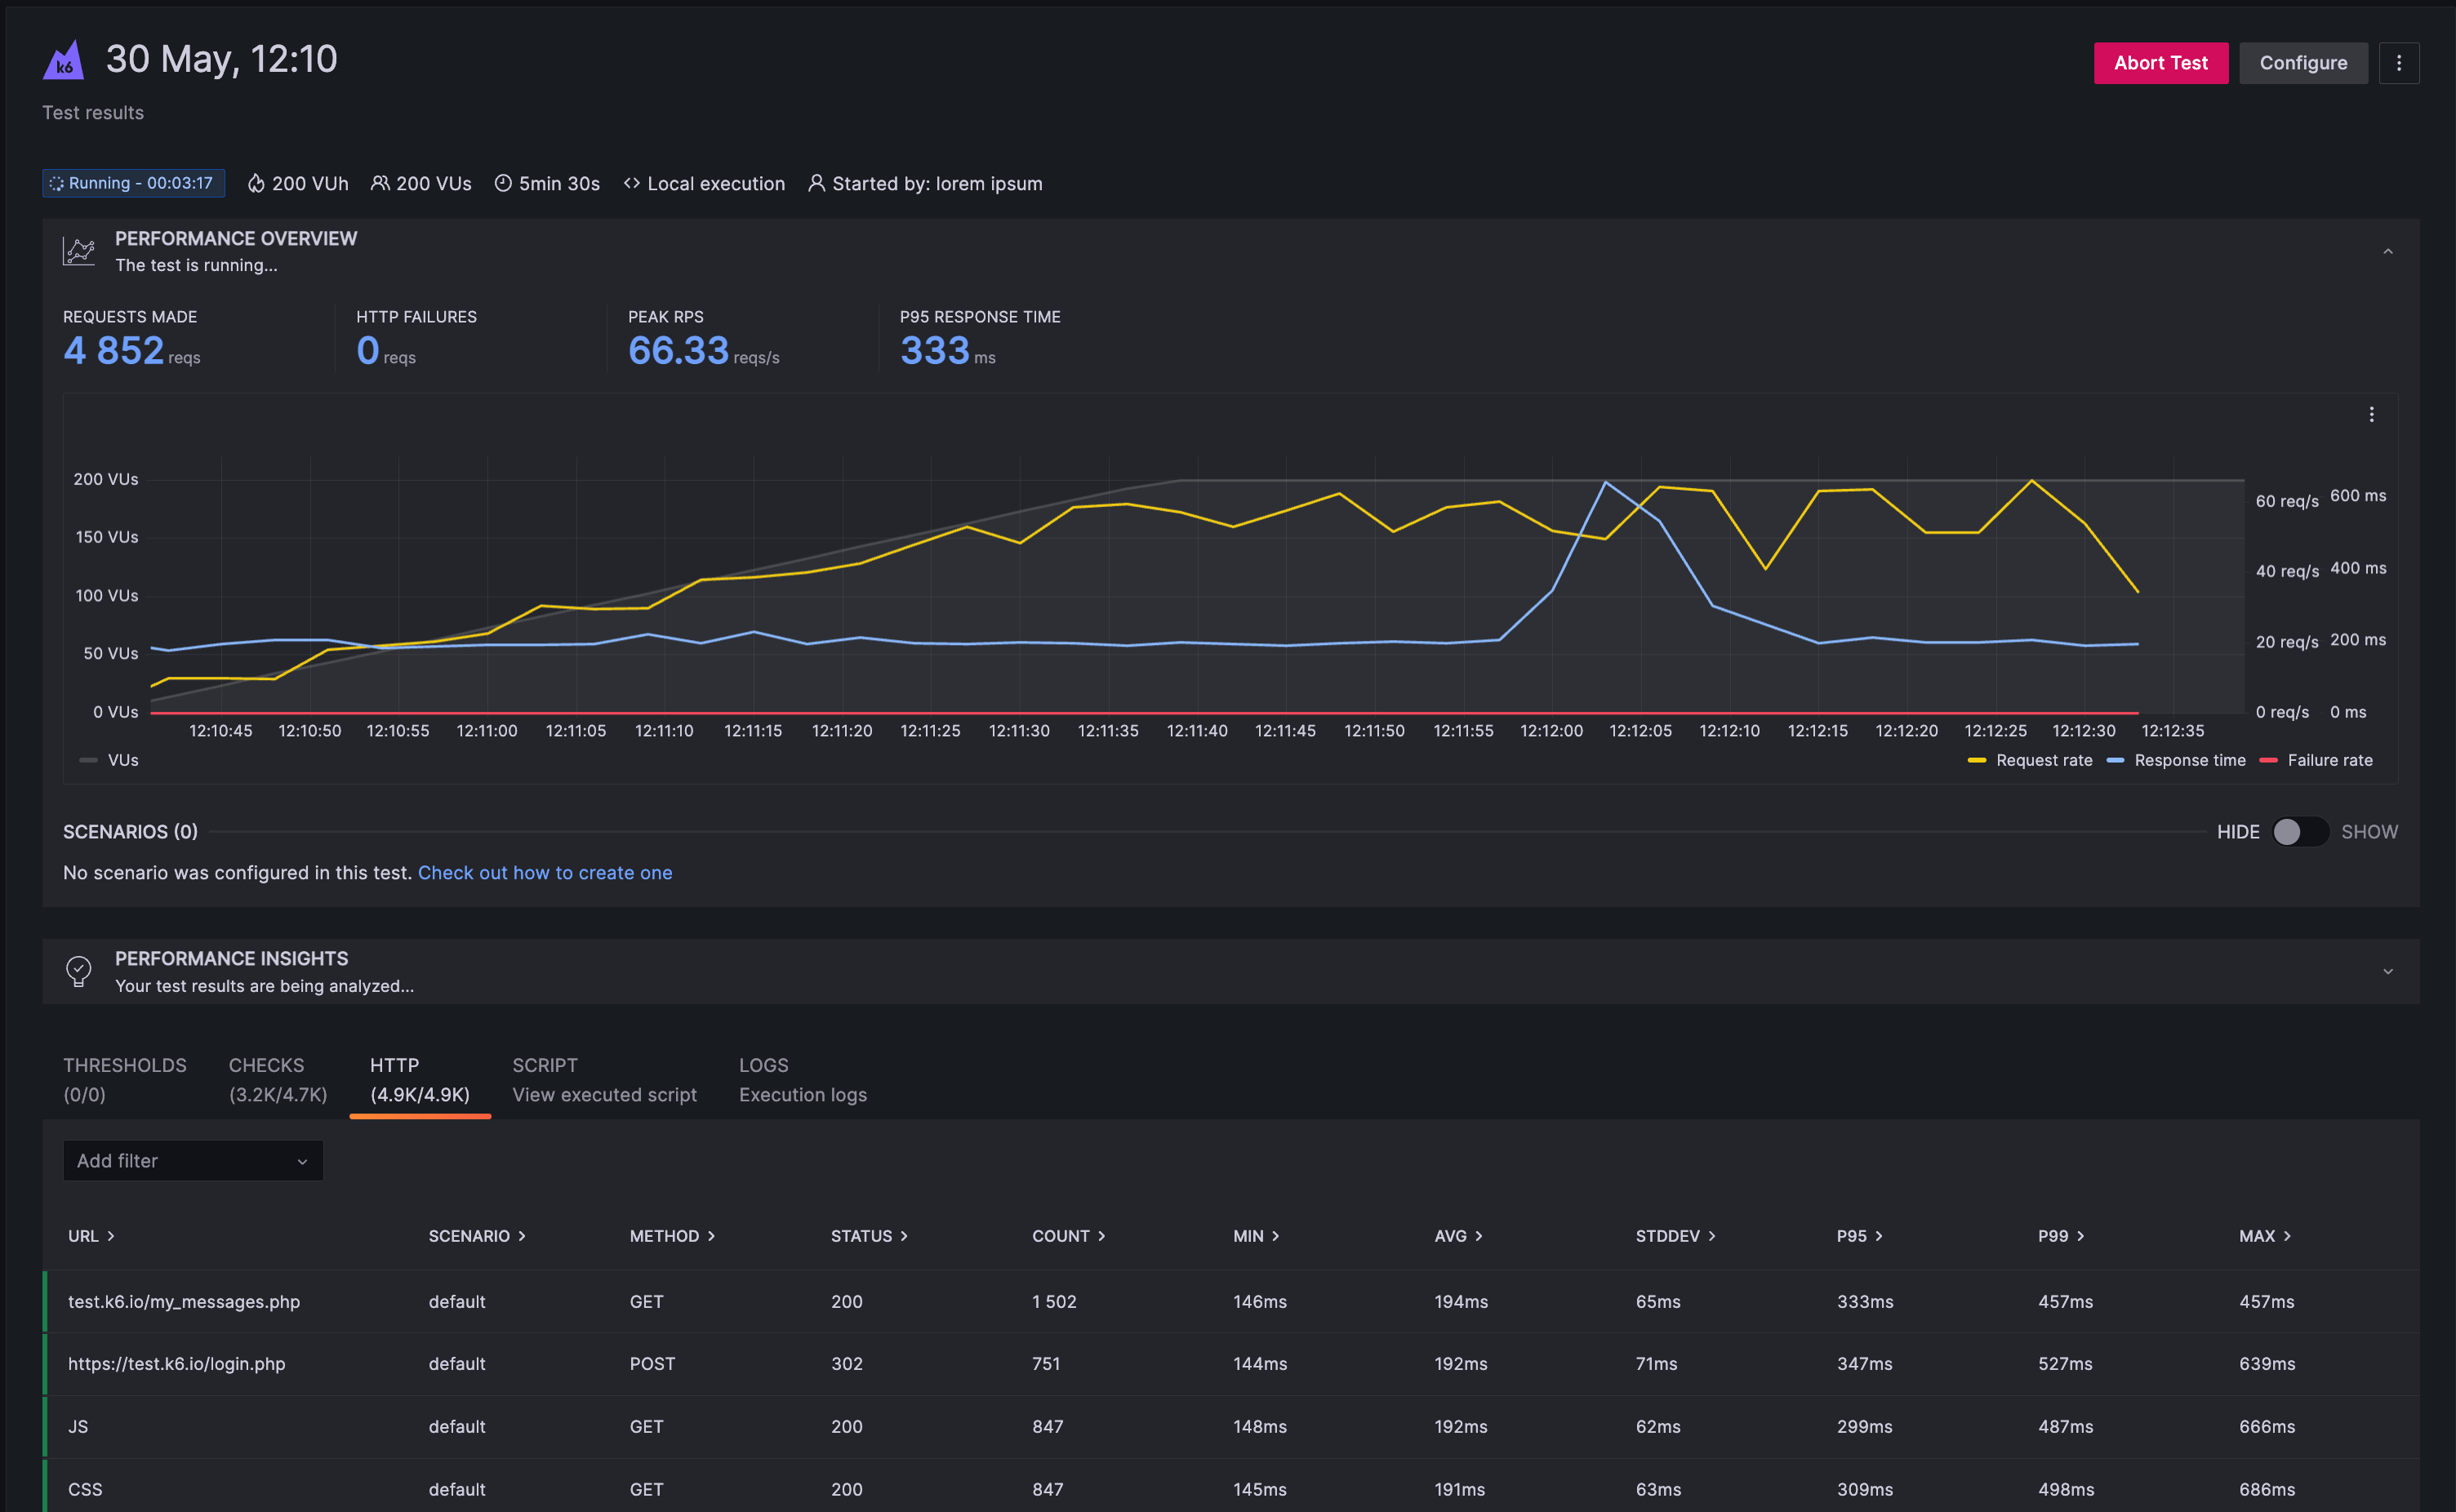
The image below shows an example k6 test results dashboard.
Here’s what to expect
When you complete this journey, you’ll be able to:
- Install k6 on your machine
- Write your first k6 test script
- Run a test locally and view results
- Send test results to Grafana Cloud
- Analyze test results in Grafana Cloud dashboards
Before you begin
Before you run your first k6 performance test, ensure that you have:
- A Grafana Cloud account. To create an account, refer to Grafana Cloud.
- Basic knowledge of JavaScript or TypeScript (k6 scripts are written in JavaScript/TypeScript).
- A code editor to write your scripts, such as Visual Studio Code or Cursor editors.
- Access to a terminal or command line interface.
- A basic understanding of HTTP requests and web applications.
Troubleshooting
If you get stuck, use the troubleshooting links in the milestone where the issue happens.
More to explore
Where it helps, this path links to related k6 and Grafana Cloud k6 docs without slowing the main flow.