
Charts function
The setOption(options) function is the primary method in the Apache ECharts library. The Business Charts panel calls this function with one required parameter: options.
The options parameter describes the chart in JSON format.
Getting started
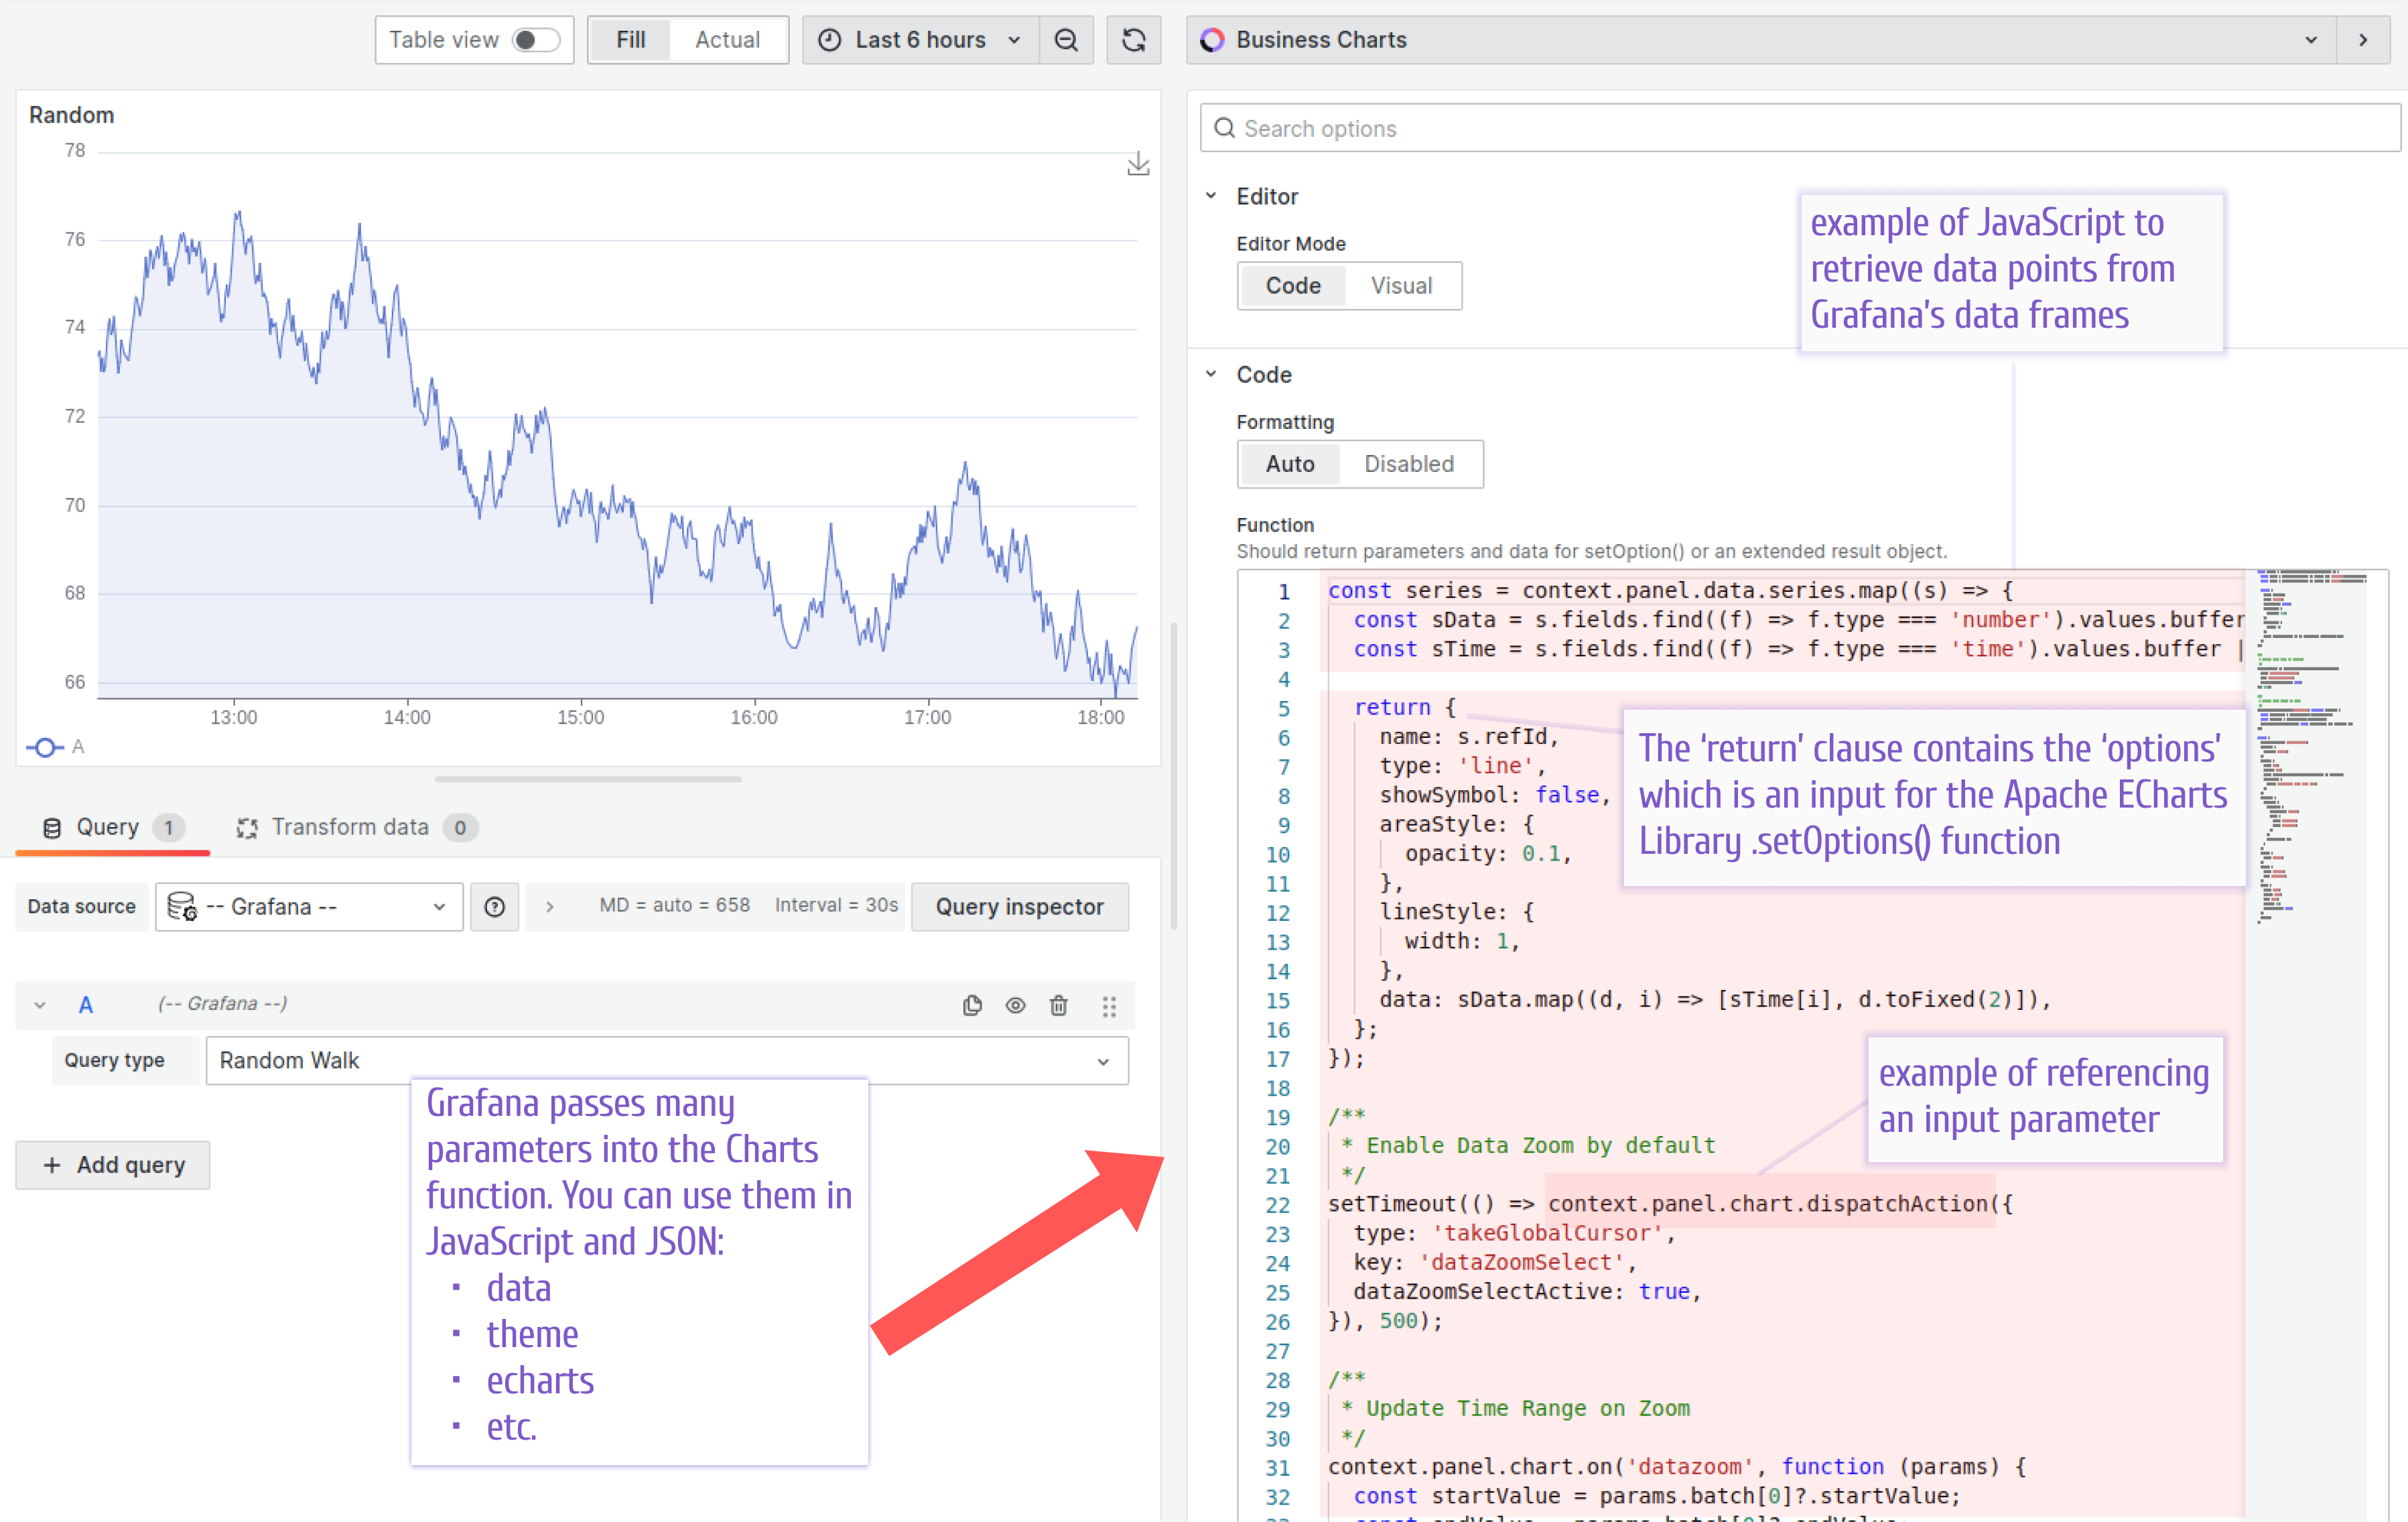
To configure the Business Charts panel, write the Charts Function. This function usually has two parts:
- JavaScript to read data points from the data source
- JSON to specify a graph as
options
Both parts can use parameters passed into the Charts function. The following table lists all available parameters.
See the following schema and screenshot for illustration.
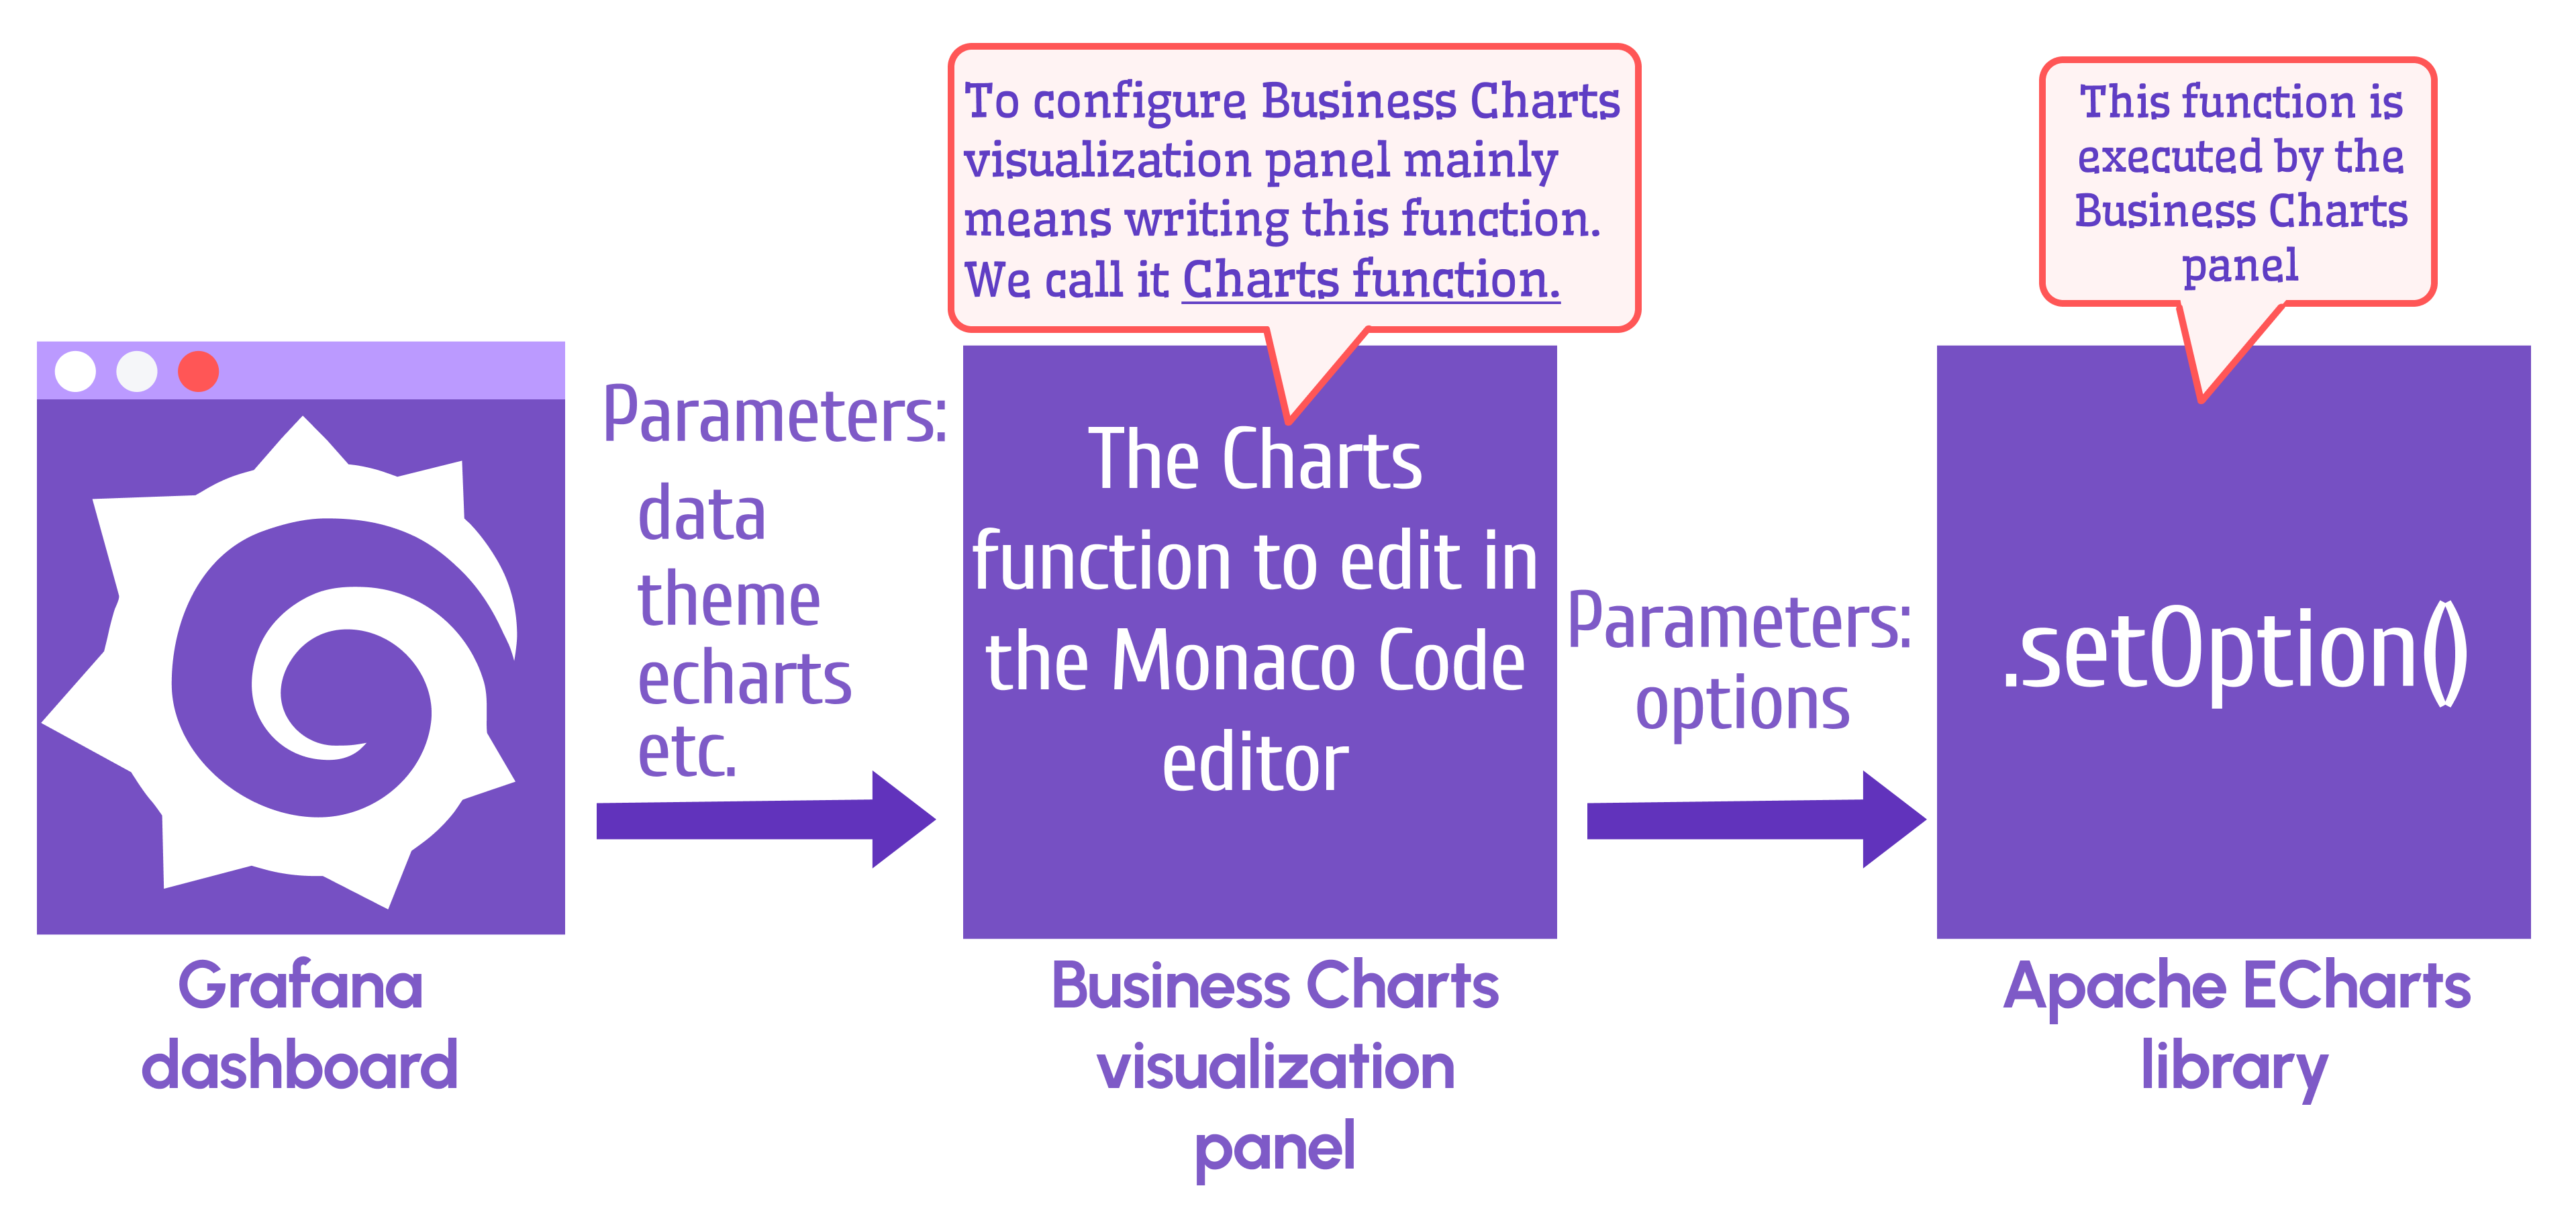
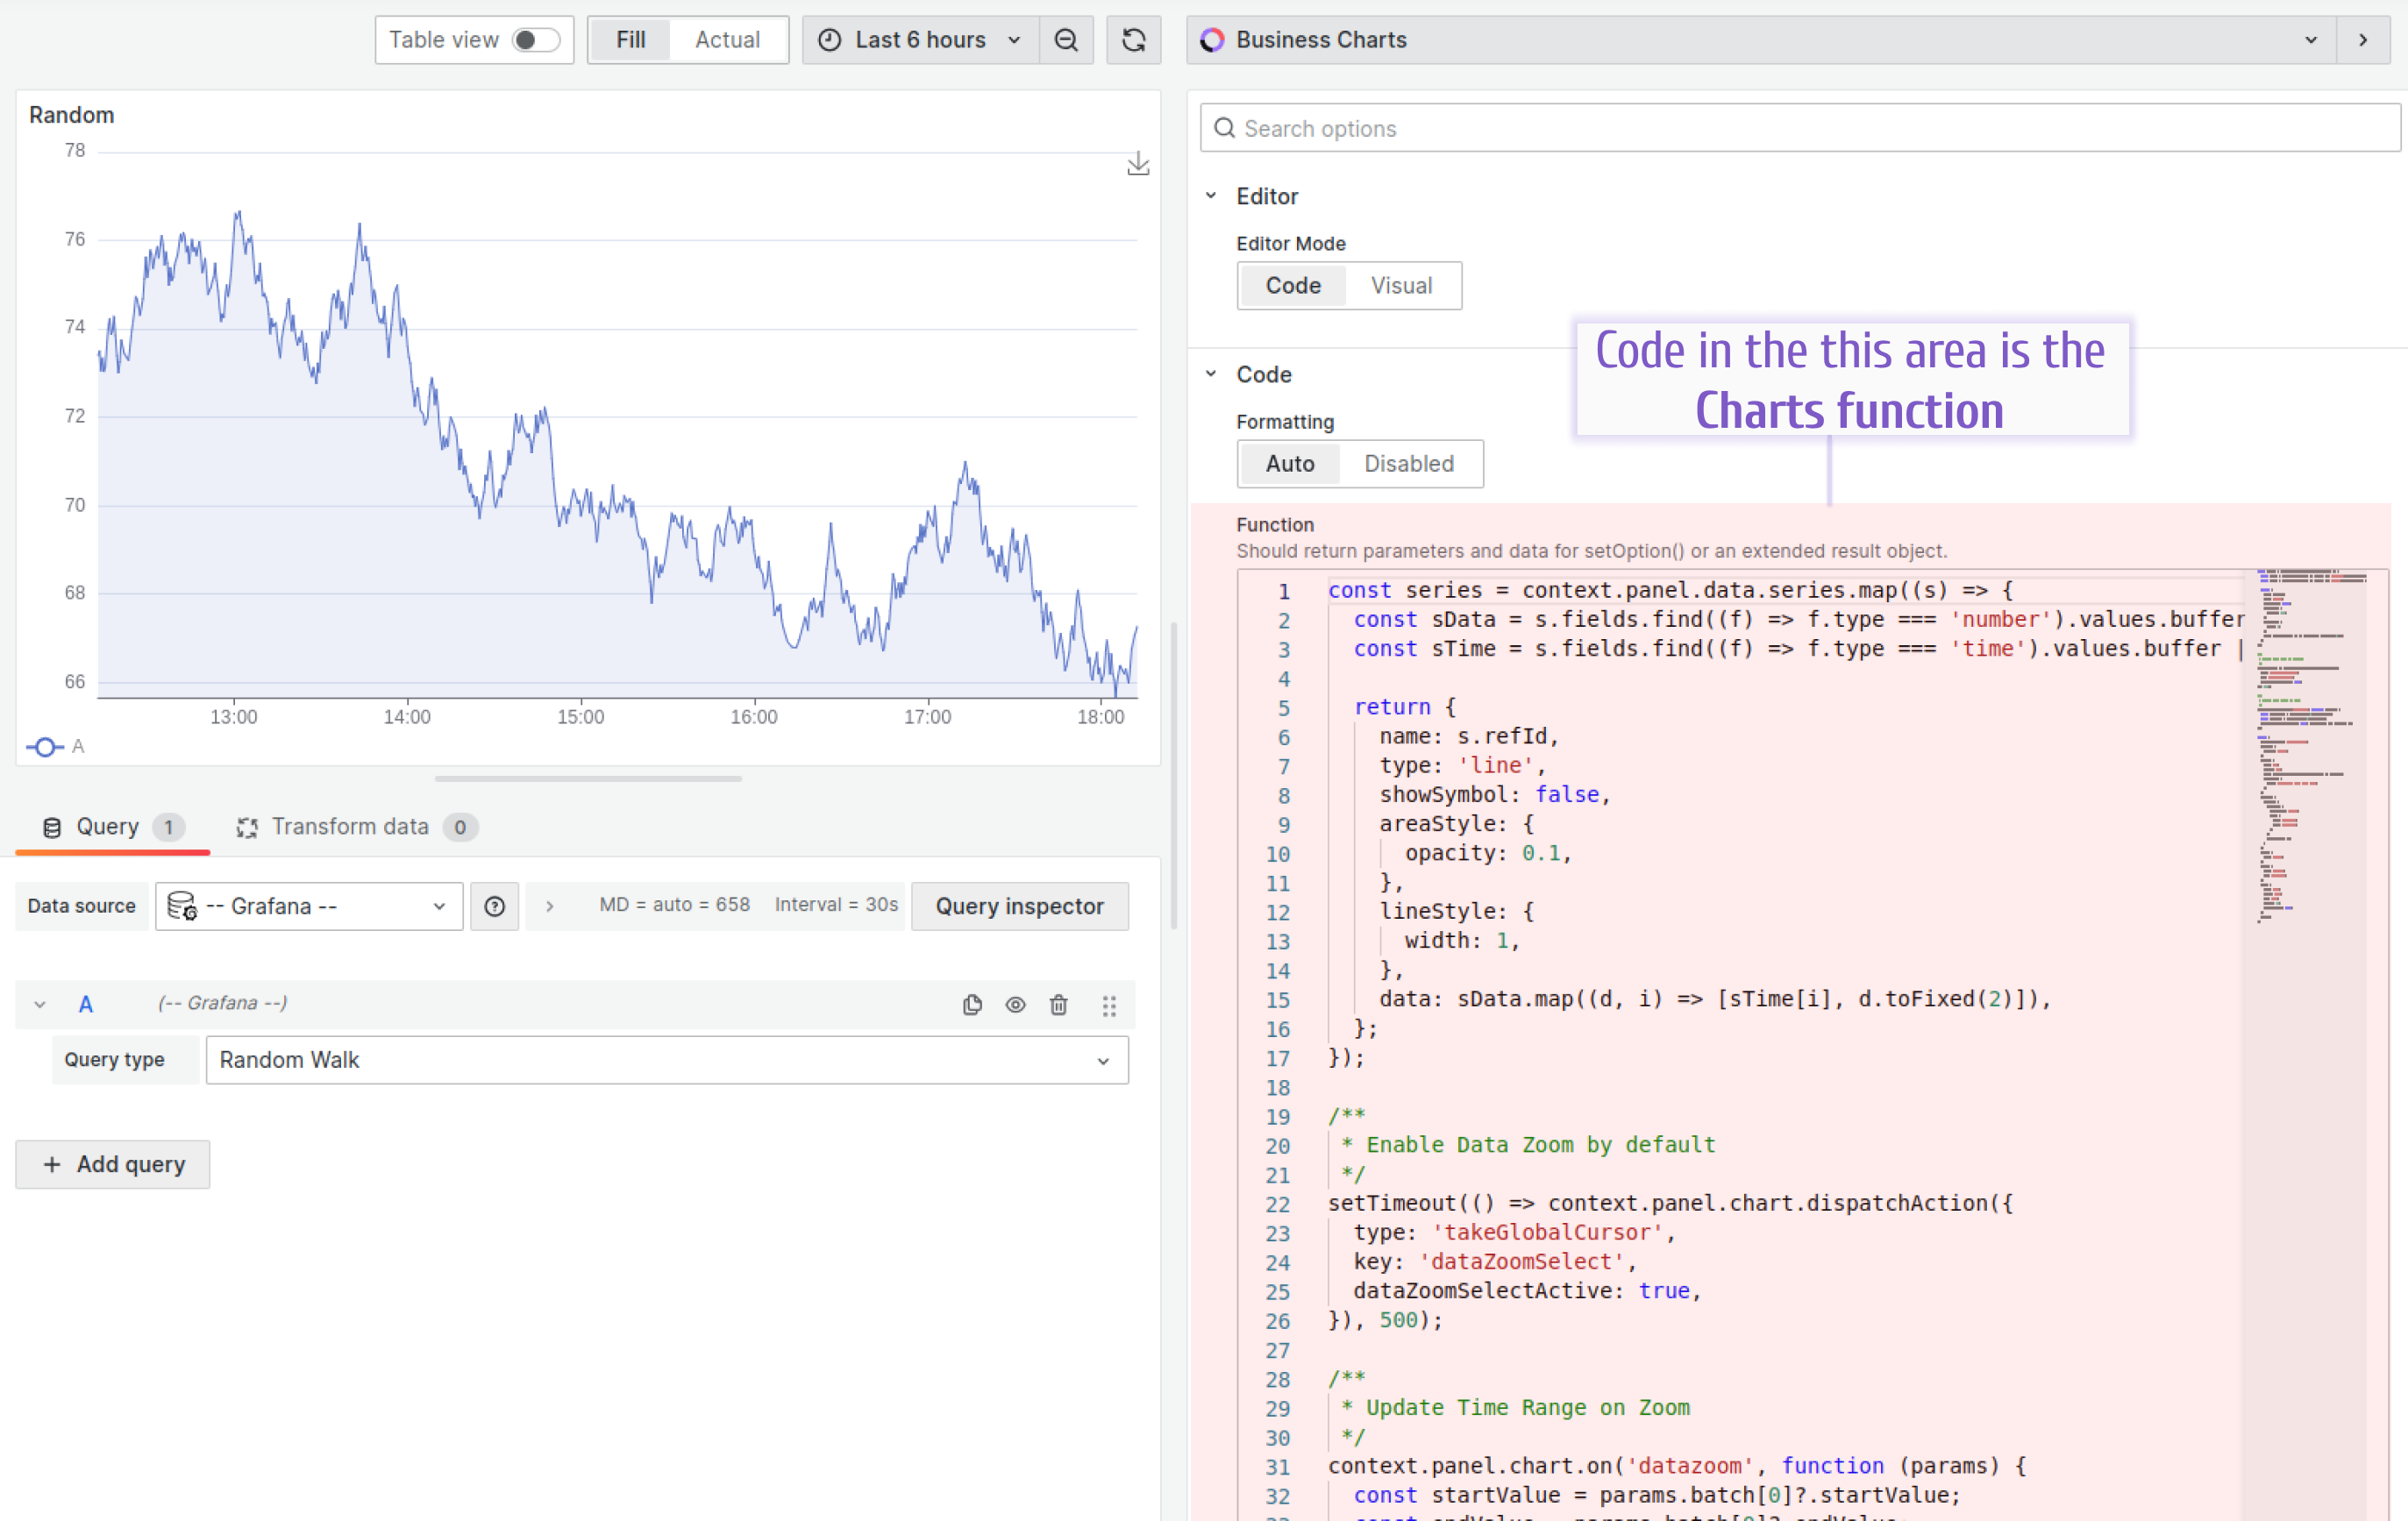
Options
Specify the options parameter in the return clause. This parameter is passed to the setOption(options) function in the Apache ECharts library.
Parameters
Inspect
To inspect those parameters, use the browser’s developer console.
console.log(
  context.panel.data,
  context.grafana.theme,
  context.panel.chart,
  context.echarts,
  context.grafana.replaceVariables,
  context.grafana.locationService
);
Notifications
You can display success and error notifications when handling specific events.
context.grafana.notifySuccess(["Update", "Values updated successfully."]);
context.grafana.notifyError([
  "Update",
  `An error occurred while updating values.`,
]);

