Menu
Grafana Cloud
Enterprise
Open source
Examples
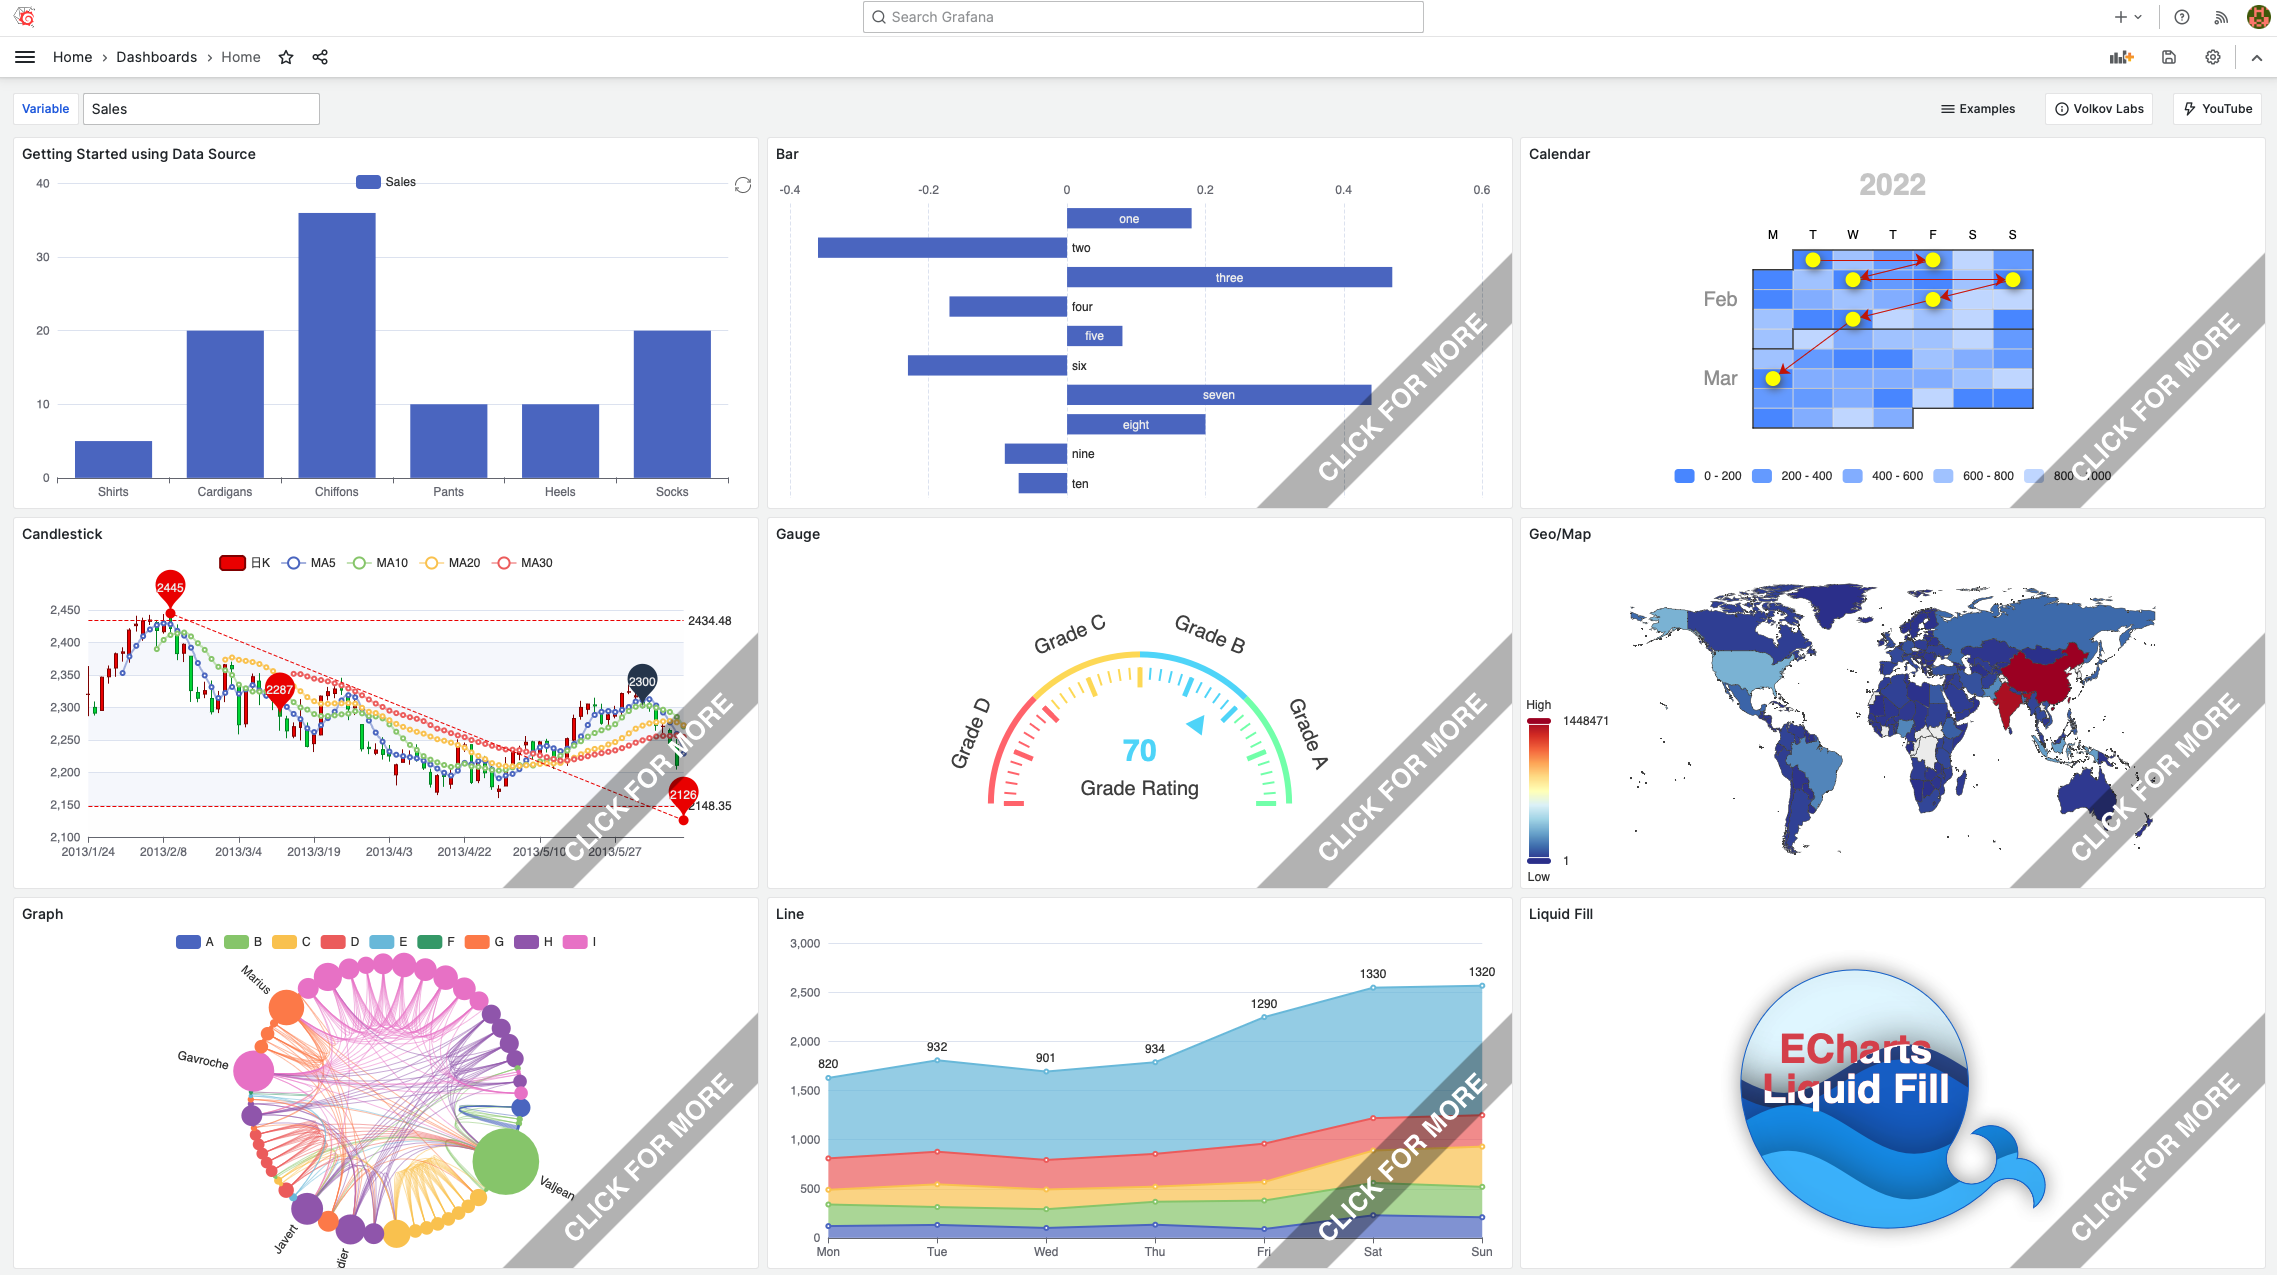
Explore over 100 ready-to-use chart examples on the Business Charts panel demo site.
Get started
Open echarts.volkovlabs.io to view chart examples.
Find a chart similar to the one you want to build.
Open the chart in edit mode (click the three vertical dots at the top right and select Edit).
- On the right, find the Code section, then the Function parameter. This is the Charts function.
- Review and experiment with the code. The dashboard is read-only, so you cannot save changes.
- Copy the Charts function code (everything in the Function parameter).
Paste the copied code into the code editor of your Business Charts visualization panel.
Refresh the chart to update its state if it doesn’t render instantly.