
Menu
Grafana Cloud
Enterprise
Open source
Event handling
You can handle specific events while viewing charts, such as mouse events, using the context.panel.chart (formerly echartsInstance) instance.
For more examples and details, see the Apache ECharts documentation on Events and Actions.
Mouse click
To prevent the event handling multiple times, all previous event handlers may be disabled.
/**
 * On Mouse Click
 */
context.panel.chart.off("click");
context.panel.chart.on("click", (params) => {
  context.grafana.notifySuccess(["Event", "On Click"]);
  context.panel.chart.resize(); // to redraw visualization
});/**
* On Double Click
*/
context.panel.chart.off("dblclick");
context.panel.chart.on("dblclick", (params) => {
context.panel.chart.resize();
});Update of time range
The Data Zoom feature allows you to select a time period on the chart for zooming in.
Once the time range is selected, the event can trigger the update of the dashboard’s time range using the context.grafana.locationService parameter similar to the functionality in native Time Series panel.
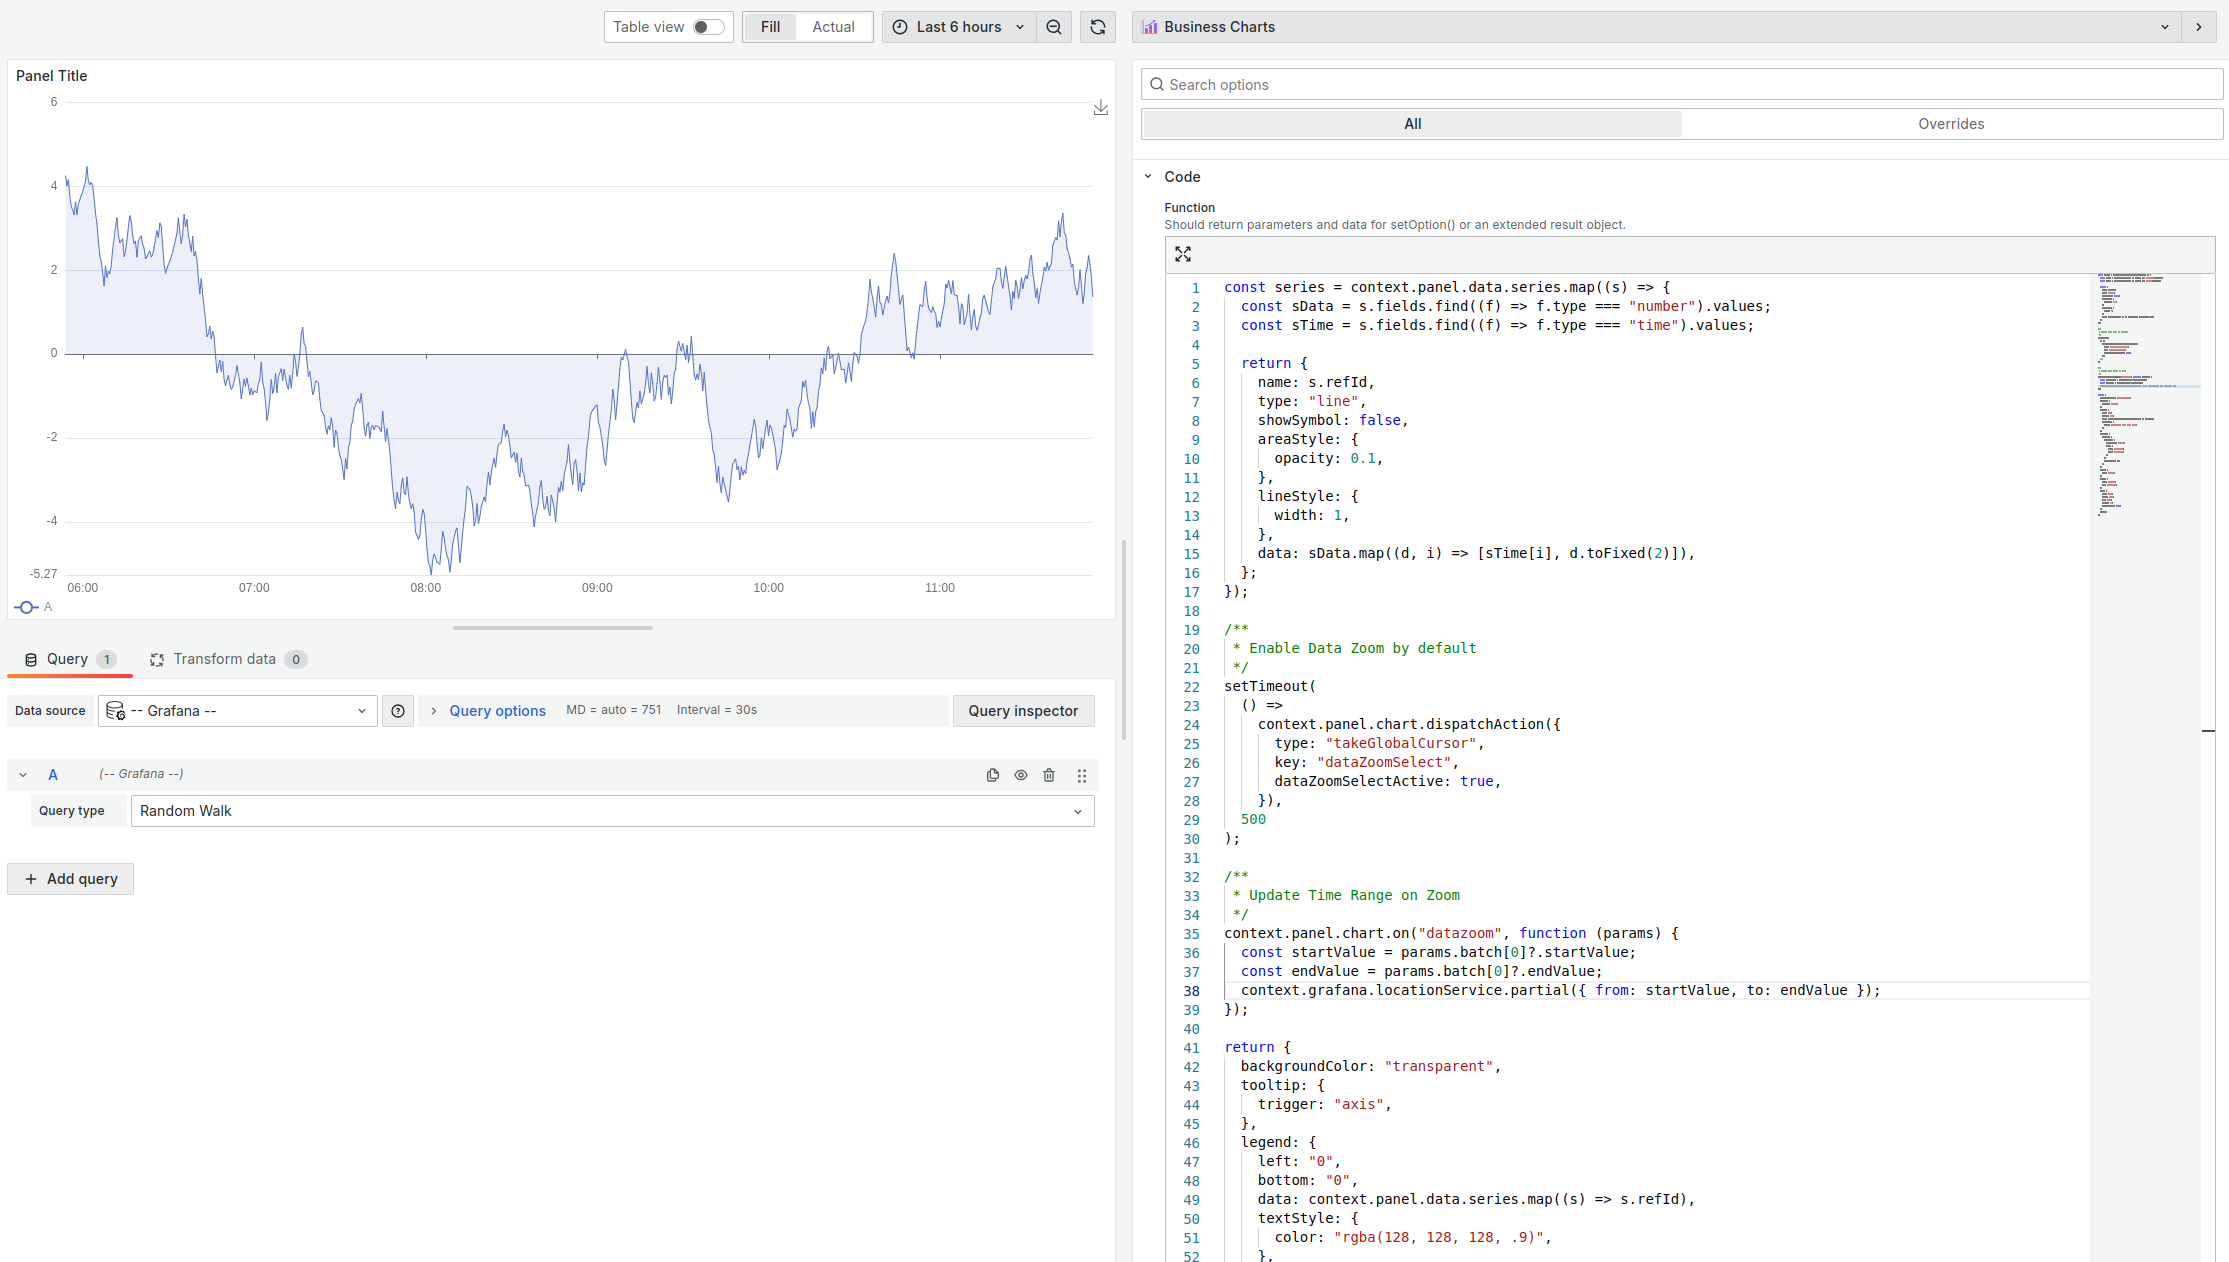
Example
const series = context.panel.data.series.map((s) => {
  const sData = s.fields.find((f) => f.type === "number").values;
  const sTime = s.fields.find((f) => f.type === "time").values;

  return {
    name: s.refId,
    type: "line",
    showSymbol: false,
    areaStyle: {
      opacity: 0.1,
    },
    lineStyle: {
      width: 1,
    },
    data: sData.map((d, i) => [sTime[i], d.toFixed(2)]),
  };
});

/**
 * Enable Data Zoom by default
 */
setTimeout(
  () =>
    context.panel.chart.dispatchAction({
      type: "takeGlobalCursor",
      key: "dataZoomSelect",
      dataZoomSelectActive: true,
    }),
  500
);

/**
 * Update Time Range on Zoom
 */
context.panel.chart.on("datazoom", function (params) {
  const startValue = params.batch[0]?.startValue;
  const endValue = params.batch[0]?.endValue;
  context.grafana.locationService.partial({ from: startValue, to: endValue });
});

return {
  backgroundColor: "transparent",
  tooltip: {
    trigger: "axis",
  },
  legend: {
    left: "0",
    bottom: "0",
    data: context.panel.data.series.map((s) => s.refId),
    textStyle: {
      color: "rgba(128, 128, 128, .9)",
    },
  },
  toolbox: {
    feature: {
      dataZoom: {
        yAxisIndex: "none",
        icon: {
          zoom: "path://",
          back: "path://",
        },
      },
      saveAsImage: {},
    },
  },
  xAxis: {
    type: "time",
  },
  yAxis: {
    type: "value",
    min: "dataMin",
  },
  grid: {
    left: "2%",
    right: "2%",
    top: "2%",
    bottom: 24,
    containLabel: true,
  },
  series,
};

