Azure / Insights / Virtual Machines - OpenTelemetry - Process Monitoring
Monitors individual processes running on Azure Virtual Machines using OpenTelemetry metrics collected by VM Insights. Shows per-process thread counts, uptime, CPU utilization and time (top consumers and maximums), memory utilization and usage, and disk read/write operations. Scoped by subscription, resource group, and VM.
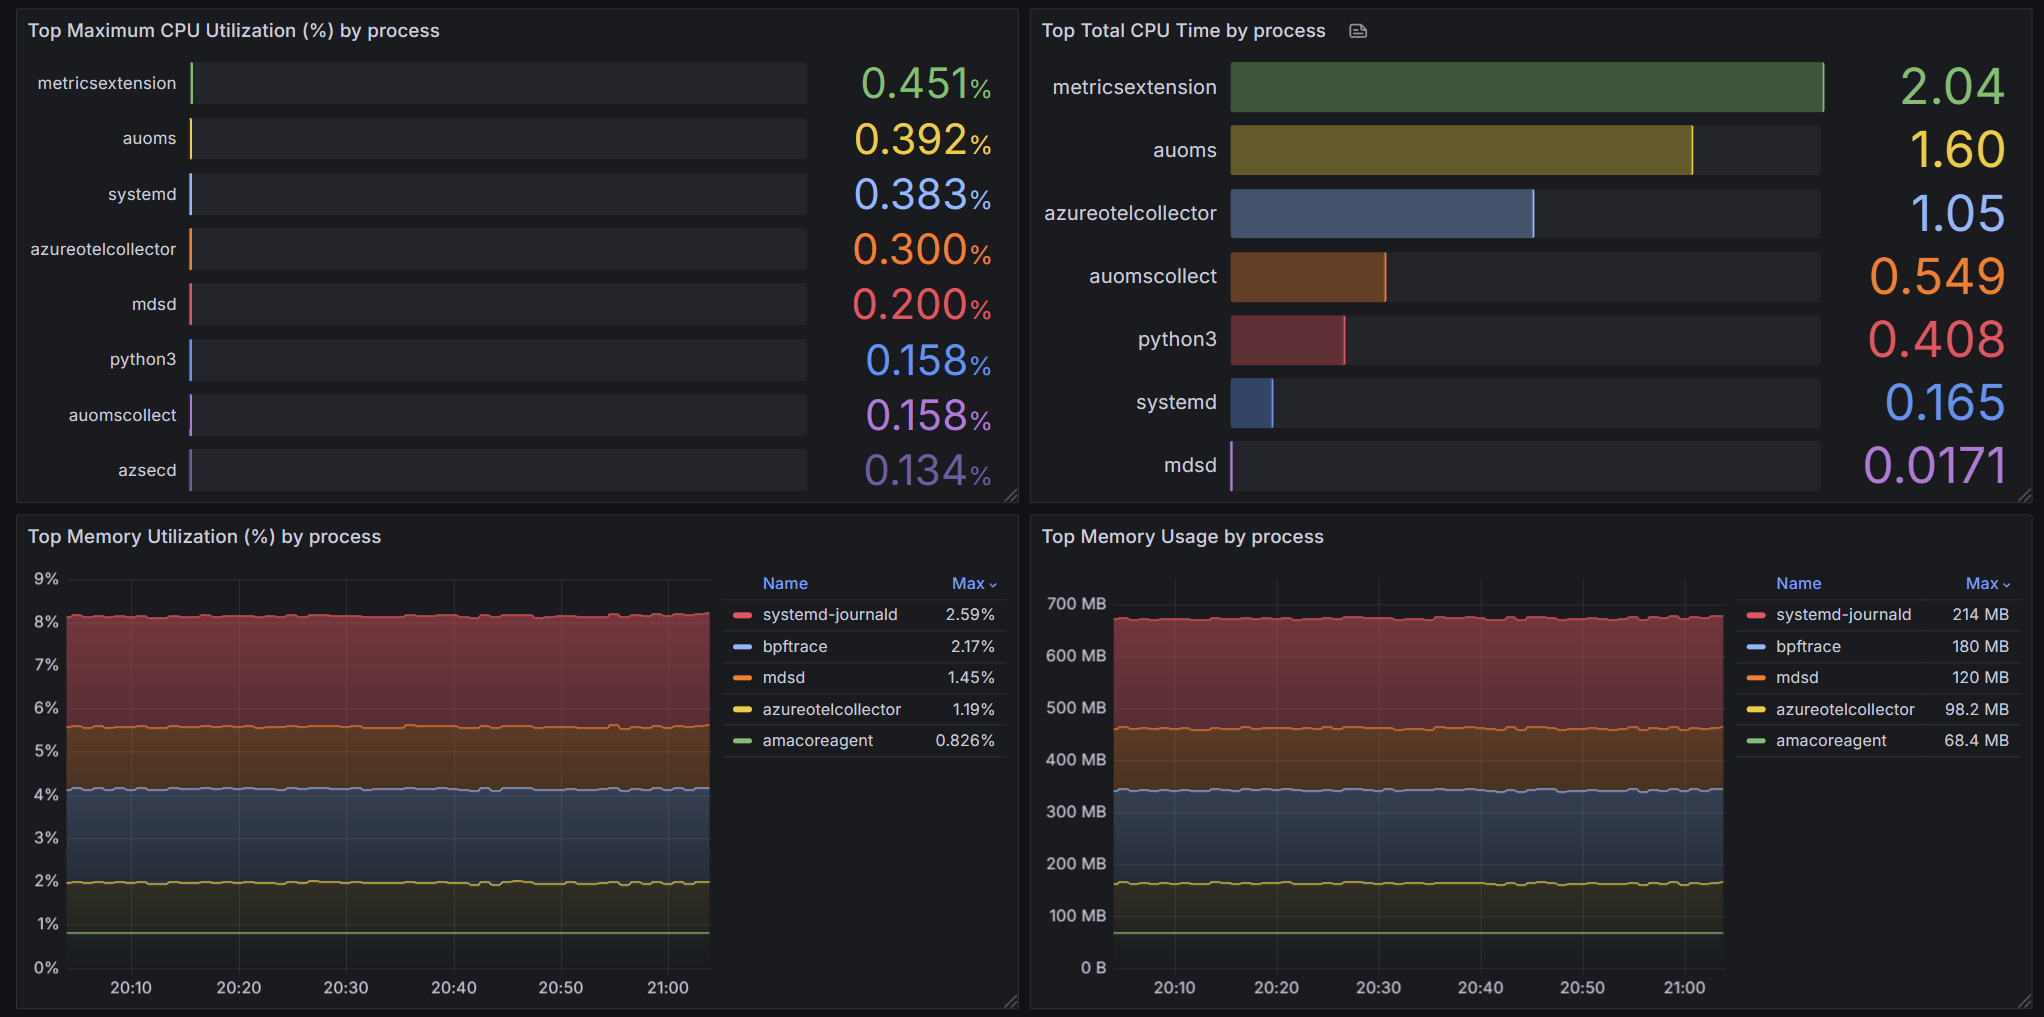
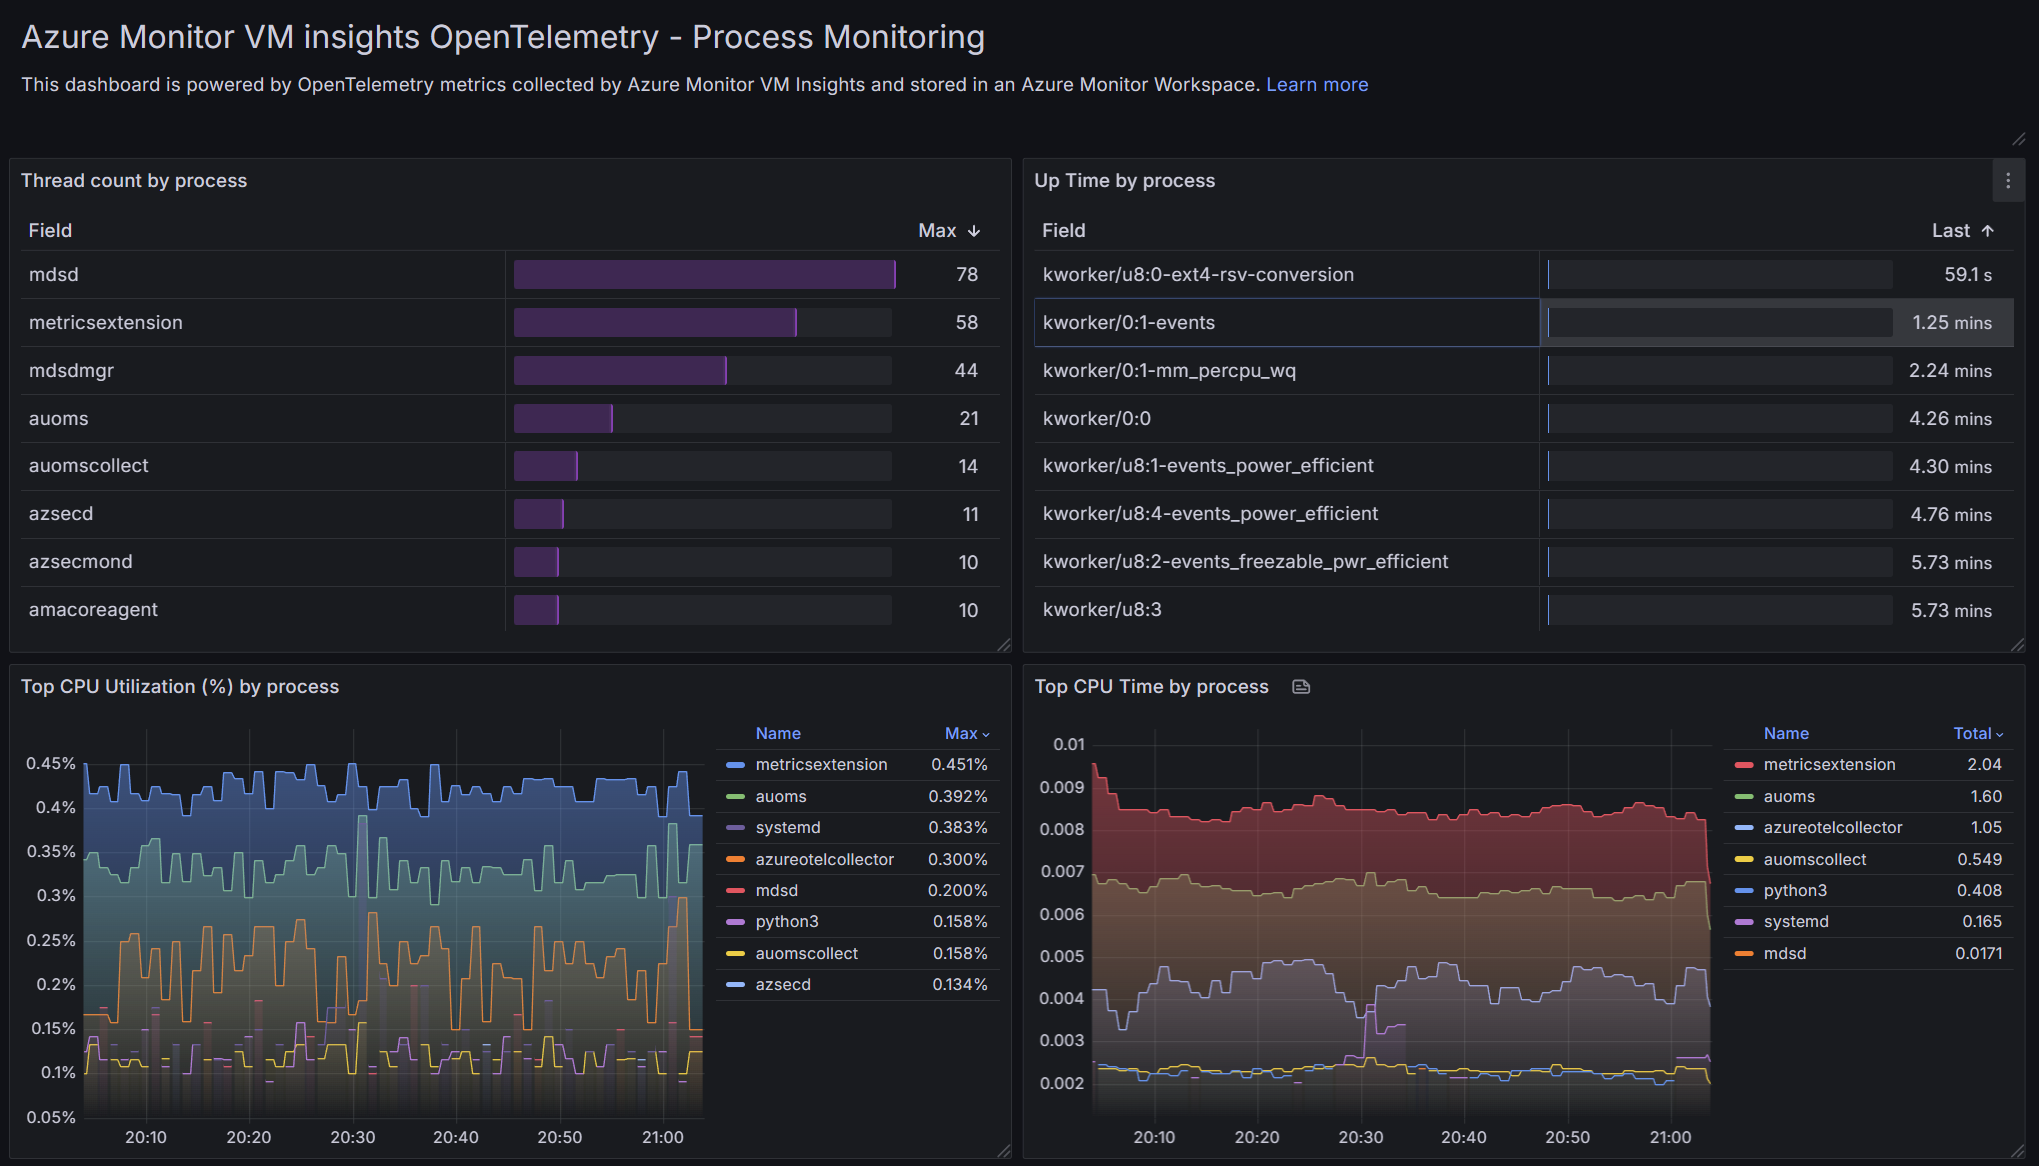
The Azure / Insights / Virtual Machines - OpenTelemetry - Process Monitoring dashboard uses the prometheus data source to create a Grafana dashboard with the bargauge, table, text and timeseries panels.
Data source config
Collector type:
Collector plugins:
Collector config:
Revisions
Upload an updated version of an exported dashboard.json file from Grafana
| Revision | Description | Created | |
|---|---|---|---|
| Download |
Azure Cosmos DB
With the Grafana plugin for Azure Cosmos DB, you can quickly visualize and query your Azure Cosmos DB data from within Grafana.
Learn more