Plugins 〉Zoom

Zoom

Zoom Data Source Plugin for Grafana
Description
The Zoom Data Source Plugin is a Grafana backend datasource plugin that integrates with Zoom's REST API v2 to query meeting metrics, QoS data, user activity, Zoom Room health, and phone device status from Grafana dashboards, Explore, and Alerting.
Zoom is a cloud communications platform that provides video meetings, room systems, user management, and phone services. This plugin provides visibility into Zoom account activity by allowing users to explore meetings, meeting quality, room health, user listings, and phone device status directly within Grafana.
Features
- Query and visualize meeting details, meeting QoS, participant QoS, Zoom Room health, user activity, and phone device status from Grafana
- Support for multiple Zoom data categories including Meetings, Zoom Rooms, Users, and Phones
- Live and historical meeting analysis, including aggregated and time-series QoS views
- Automatic 30-day chunking for past meeting queries to comply with Zoom API time-window limits
- Pre-built dashboards for Zoom overview, meeting quality, user details, and Zoom Room monitoring
- Automatic retry handling for transient API failures, including rate limits and server-side errors
- Compatibility with Grafana dashboards, Explore, and Alerting workflows
Compatibility
| Component | Version / Detail |
|---|---|
| Grafana | >= 12.3.0 |
| Zoom API | REST API v2 |
| Authentication | Server-to-Server OAuth (Account ID, Client ID, Client Secret) |
| Zoom Account | Pro, Business, or Enterprise (Business+ recommended for Heavy/Dashboard APIs) |
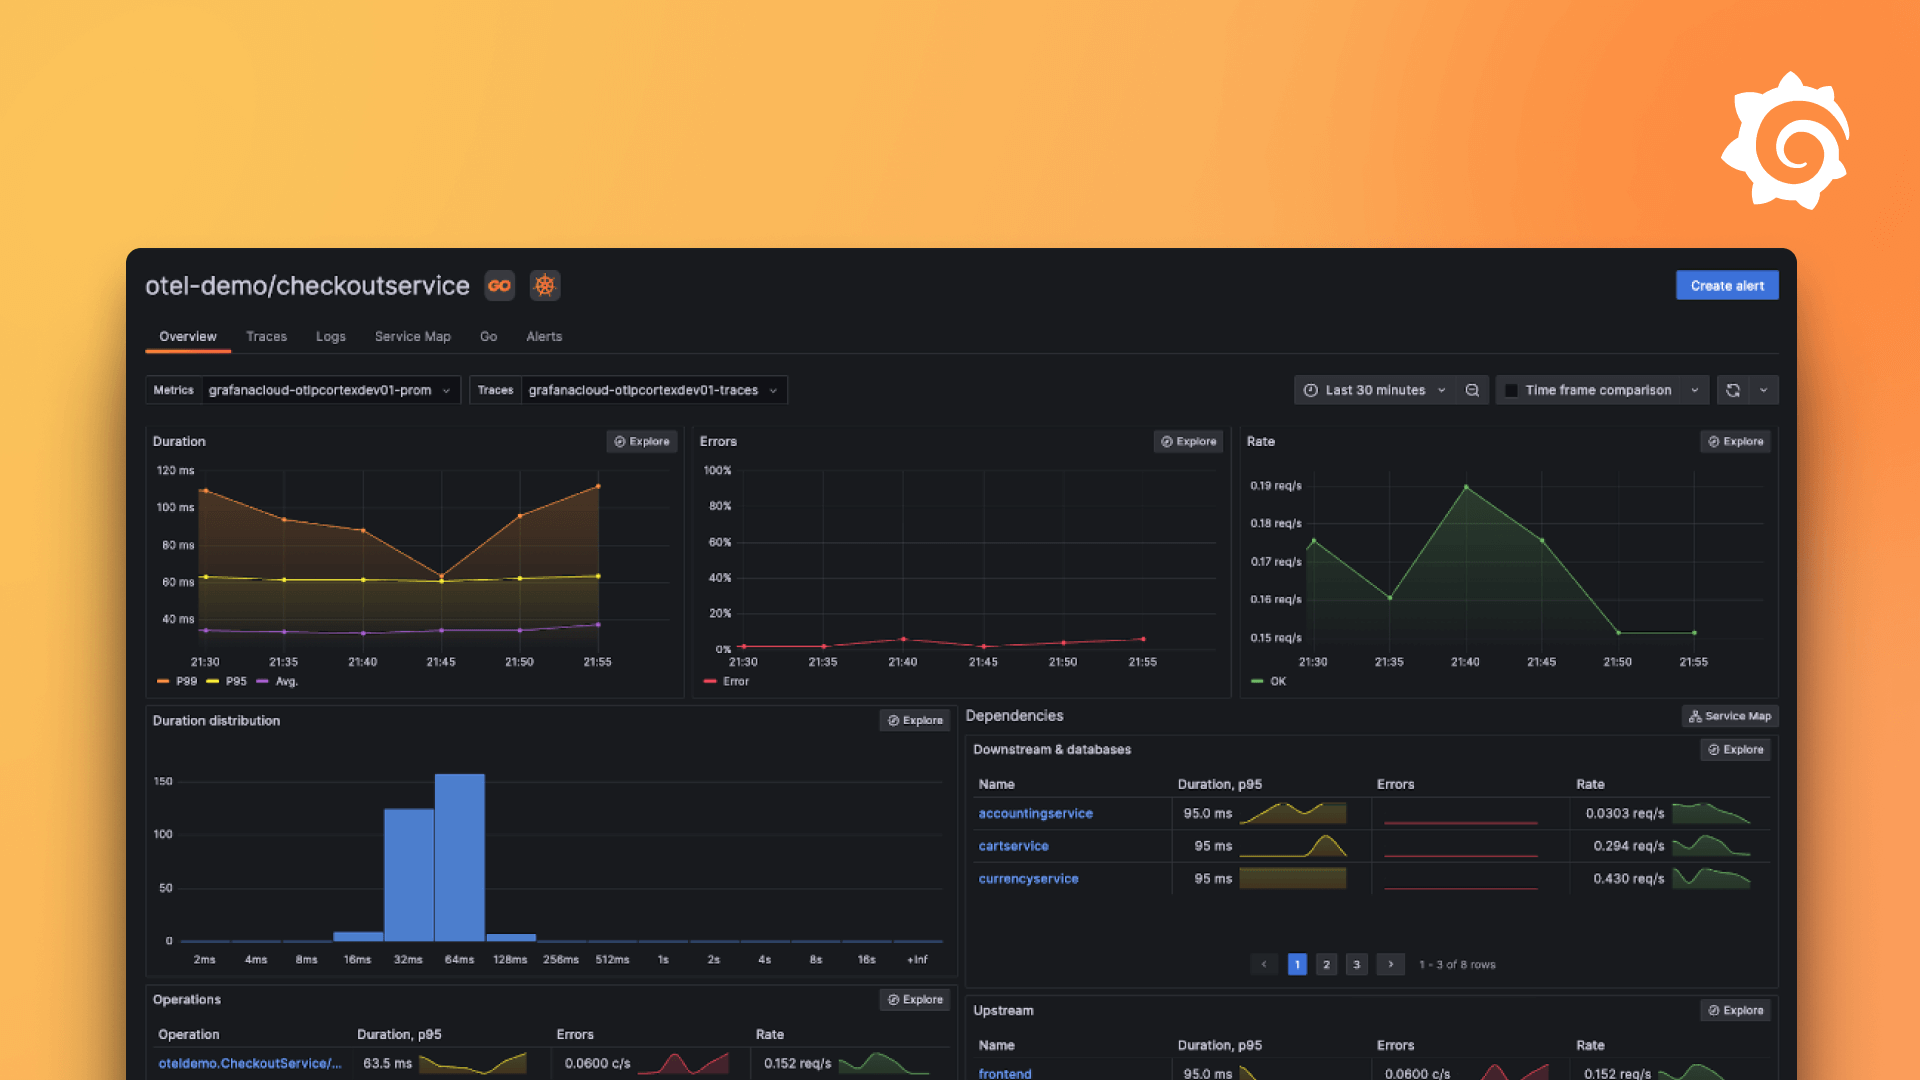
Visuals
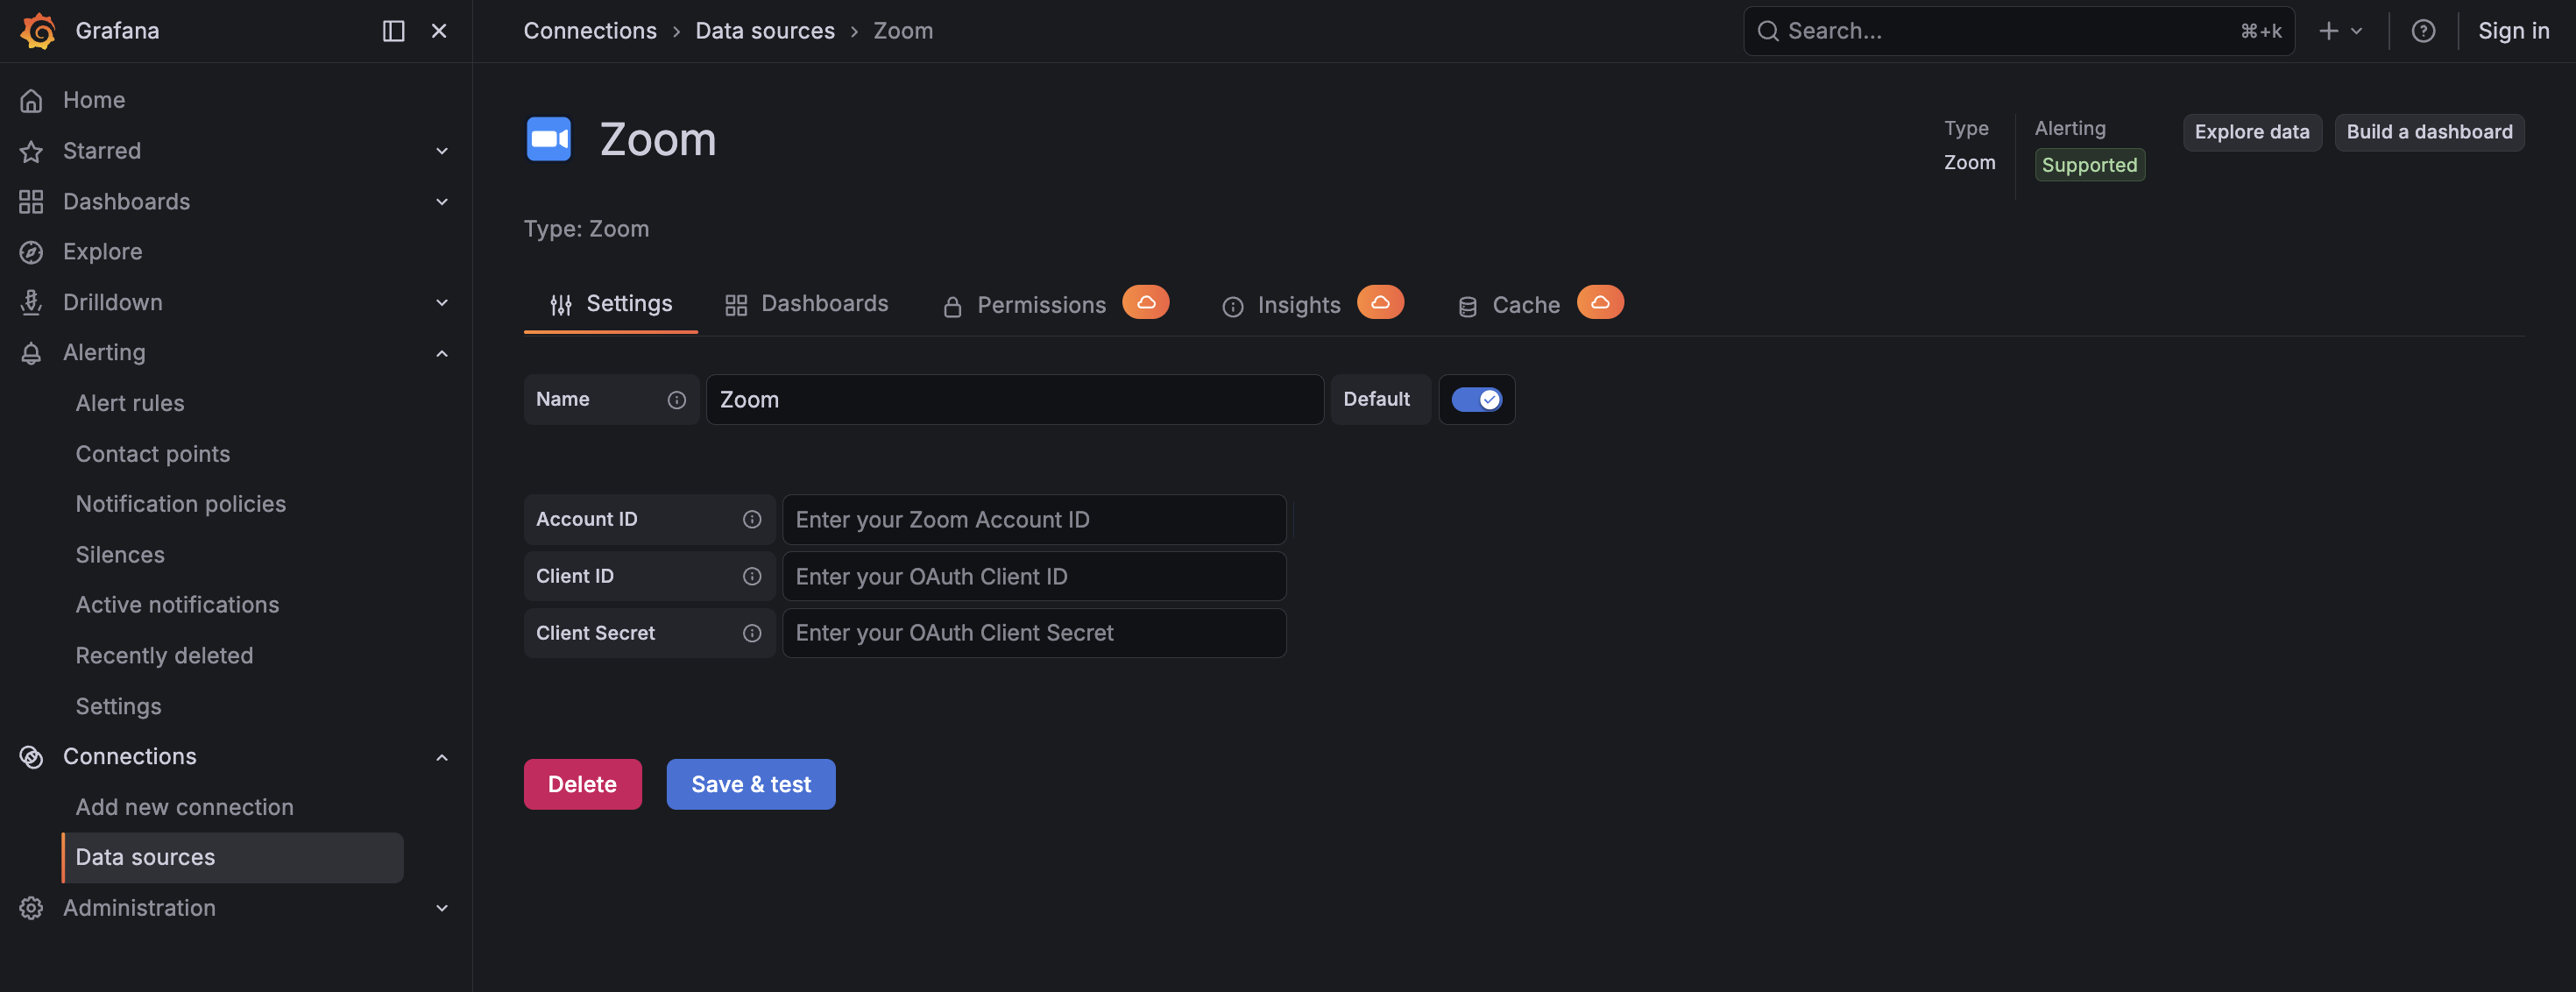
Configuration Editor

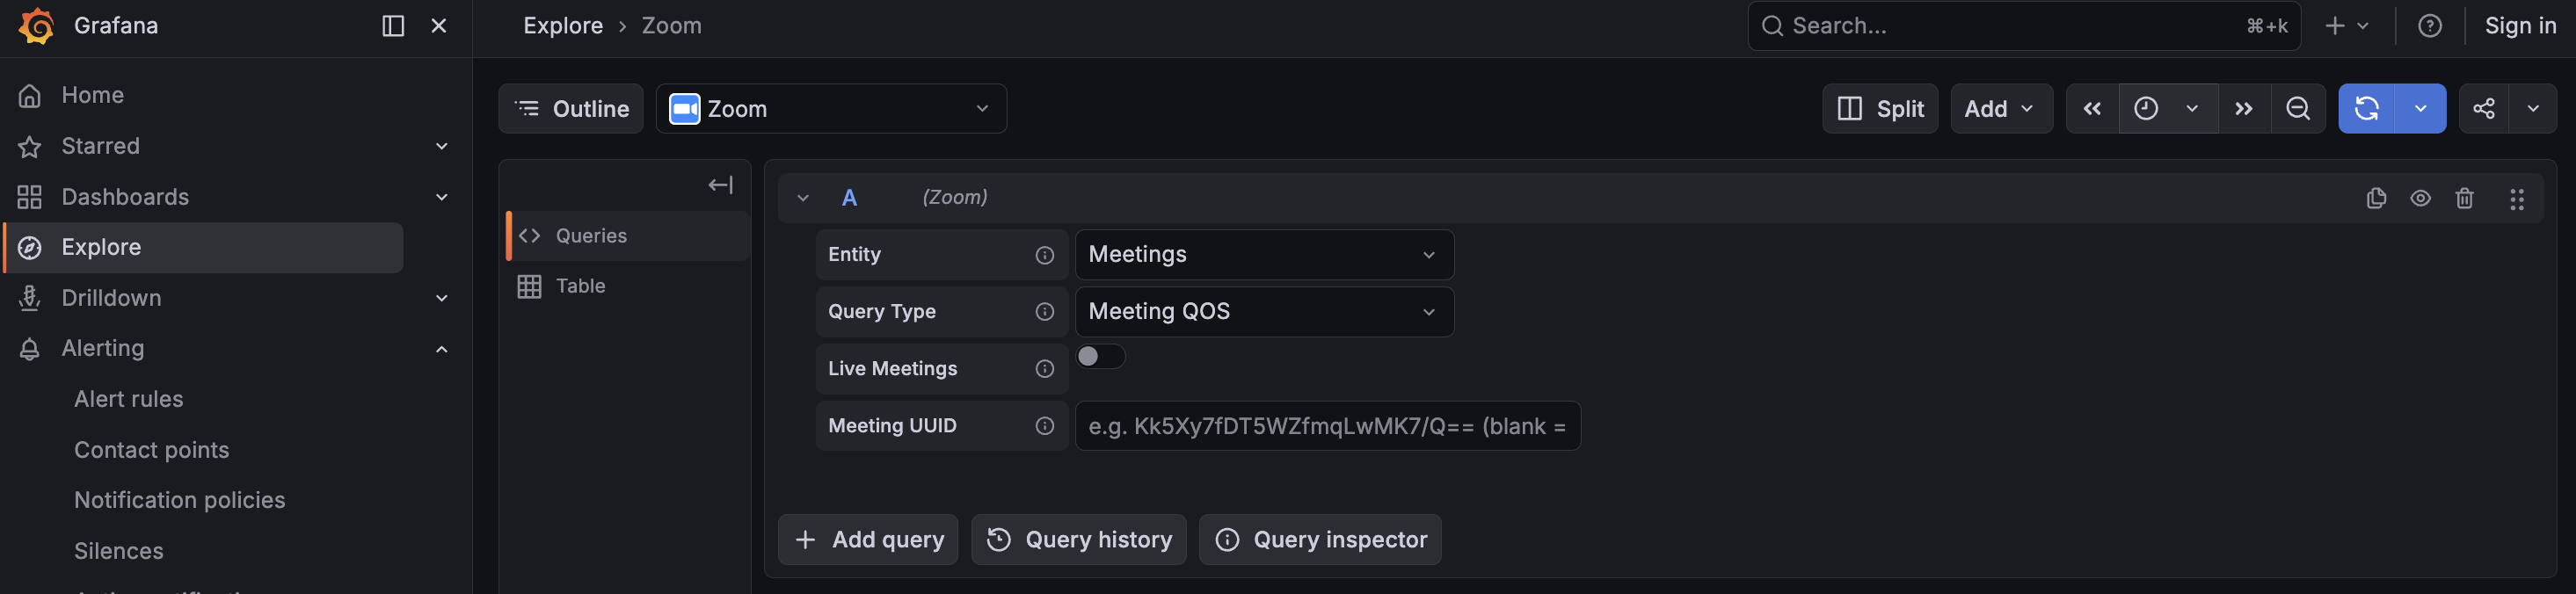
Query Editor
Installation
Requirements
- Grafana >= 12.3.0
- A Zoom Pro, Business, or Enterprise account (Business+ recommended for Heavy/Dashboard APIs)
- Admin-level access to the Zoom App Marketplace to create a Server-to-Server OAuth app
- The following OAuth scopes granted to the app:
dashboard_meetings:read:admindashboard_zoomrooms:read:adminuser:read:adminroom:read:adminphone:read:adminmeeting:read:admin
Obtaining Zoom Credentials
- Sign in to the Zoom App Marketplace as an account admin.
- Click Develop -> Build App.
- Select Server-to-Server OAuth and click Create.
- Provide an app name such as
Grafana Zoom Data Sourceand click Create. - On the App Credentials tab, copy the following values:
- Account ID
- Client ID
- Client Secret
- On the Information tab, fill in the required company and developer contact fields.
- On the Scopes tab, add all required scopes listed above.
- On the Activation tab, click Activate your app.
Install the Plugin
Install the plugin from the Grafana Plugin Catalog or using the Grafana CLI:
grafana cli plugins install crestdata-zoom-datasource
After installation, restart the Grafana server for the plugin to be loaded.
Configure the Data Source
- In Grafana, navigate to Connections > Data Sources > Add data source.
- Search for Zoom and select it.
- Fill in the required configuration fields:
| Name | Type | Required | Description |
|---|---|---|---|
| Account ID | String | Yes | Zoom account identifier from the Server-to-Server OAuth app credentials |
| Client ID | String | Yes | OAuth Client ID of the Server-to-Server OAuth app |
| Client Secret | Secured String | Yes | OAuth Client Secret, stored securely by Grafana |
| API Base URL | String | No | Zoom REST API base URL; defaults to https://api.zoom.us/v2 |
| OAuth Token URL | String | No | Zoom OAuth token endpoint; defaults to https://zoom.us/oauth/token |
- Click Save & Test to validate the credentials and required Zoom API access.
Usage
Query Editor
Once the data source is configured, you can create panels using the query editor with the following parameters:
| Parameter | Type | Options | Default | Description |
|---|---|---|---|---|
| Entity | Dropdown | Meetings, Zoom Rooms, Users, Phones | Meetings | Top-level Zoom data category to query |
| Query Type | Dropdown | Varies by selected entity | Details | Specific query mode for the selected entity |
| Live Meetings | Toggle | Enabled, Disabled | Disabled | Fetch live meetings and ignore the selected time range where supported |
| Meeting ID | String | NA | NA | Optional for QoS queries; when blank, the plugin iterates all meetings |
| Participant ID | String | NA | NA | Optional filter for participant-level QoS queries |
| Room ID | String | NA | NA | Required for Zoom Rooms > Associated Meetings |
Meetings
| Query Type | Time Range | Required Fields | Output |
|---|---|---|---|
| Details | Yes (or Live toggle) | NA | Table of meetings with host, participants, duration, and quality ratings |
| Meeting QOS | Yes (or Live toggle) | meetingId (optional) | Table with one row per meeting and averaged QoS metrics |
| Meeting QOS Series | Yes (or Live toggle) | meetingId (optional) | Time series of QoS metrics per timestamp |
| Participant QOS | Yes (or Live toggle) | meetingId, participantId (optional) | Table with one row per participant |
| Participant QOS Series | Yes (or Live toggle) | meetingId, participantId (optional) | Time series of raw per-sample metrics per participant |
When Meeting ID is blank for a QoS query, the plugin iterates all meetings in the selected panel time range and concatenates the results.
Zoom Rooms
| Query Type | Time Range | Required Fields | Output |
|---|---|---|---|
| Details | No | NA | Table of all Zoom Rooms with health, status, and components |
| Associated Meetings | Yes | roomId (required) | Table of past meetings for the room; any in-progress live meeting is included automatically |
Users / Phones
Both expose Details:
- Users returns a table listing users, including license type, department, and activity fields
- Phones returns a table listing account-wide phone device status with site and assignee mapping
Time Range Handling
Past meeting queries are split into 30-day chunks to stay within Zoom's API time-window limits. The plugin merges paginated responses transparently, so no manual action is required from the user.
| Scenario | Behaviour |
|---|---|
| Live toggle enabled | Fetches live meetings; date range is ignored |
| Past meetings, range <= 30 days | Single date-range request |
| Past meetings, range > 30 days | Split into 30-day chunks, results merged |
| Users / Phones details | Account-wide listings; time range ignored |
Error Handling and Retry Strategy
Retries are performed automatically for transient failures:
- HTTP 429 (rate limited) while honoring the
Retry-Afterheader - HTTP 5xx responses with exponential backoff
- Network or connection-level errors with exponential backoff
- One-time token refresh on applicable
401 Unauthorizedquery failures
Max retry attempts: 3. Non-retryable errors such as most HTTP 4xx responses are returned immediately.
Common issues:
| Symptom | Likely Cause | Fix |
|---|---|---|
Health check failed on Save & Test | Account ID, Client ID, or Client Secret is missing or incorrect | Fill in all three fields and verify the values in the Zoom app |
token request returned 401 | Wrong Client ID / Secret or inactive app | Re-check credentials and ensure the app is activated |
403 with insufficient scopes | OAuth app is missing required scopes | Add the missing scopes in the Zoom app and retry |
rate limited (429) | Heavy-class quota is shared across the Zoom account | Stagger dashboard refreshes; the plugin will honor Retry-After |
Pre-built Dashboards
The plugin ships with four pre-built dashboards for quick visualization and monitoring of Zoom environments.
| Setting | Value |
|---|---|
| Default time range | Last 24 hours |
| Auto-refresh | Enabled |
| Datasource selection | Zoom |
1. Zoom Overview — Provides a high-level summary of Zoom activity, including:
- Meeting counts and activity overview
- Quality ratings
- Active room status
2. Zoom Meeting Quality — Displays per-meeting and per-participant QoS insights, including:
- Aggregated meeting QoS metrics
- Participant-level QoS metrics
- Time-series quality analysis
3. Zoom User Details — Displays user-level account insights, including:
- Active, inactive, pending, and all user listings
- License type details
- Department and activity information
4. Zoom Rooms — Provides visibility into Zoom Room environments, including:
- Room health and status
- Room component details
- Associated meeting activity
Limitations
API Limitation: Zoom dashboard APIs impose time-window restrictions on historical meeting queries, and account-wide listing endpoints such as Users and Phones do not use the Grafana time range. In addition, Heavy-class Zoom API quotas are shared across the entire Zoom account.
Design Adaptation To accommodate these constraints, the plugin splits eligible historical meeting queries into 30-day chunks, merges the results automatically, exposes a live query mode where supported, and treats account-wide listing endpoints as time-range-independent queries.
Support
For issues, questions, or feature requests, please open an issue in this repository.
Roadmap
See the open issues for a list of proposed features and known issues.
Contributing
Contributions are welcome! To get started with development:
cd crestdata-zoom-datasource
Frontend
npm install
npm run dev        # development mode with watch
npm run build      # production build
Backend
mage -v            # build backend binaries
Tests
npm run test       # frontend tests (Jest)
npm run test:ci    # CI mode
go test ./…      # backend tests
Linting
npm run lint
npm run lint:fix
Local Grafana instance (Docker)
npm run server
E2E tests (Playwright)
npm run e2e
Before submitting a pull request:
- Run the linter and ensure all tests pass.
- Validate the plugin using the Grafana Plugin Validator.
- Ensure any changes to
plugin.jsonare intentional — a Grafana server restart is required after such changes.
Authors and Acknowledgment
Developed by Crest Data.
License
This plugin is distributed under EULA LICENSE.
References
Grafana Cloud Free
- Free tier: Limited to 3 users
- Paid plans: $55 / user / month above included usage
- Access to all Enterprise Plugins
- Fully managed service (not available to self-manage)
Self-hosted Grafana Enterprise
- Access to all Enterprise plugins
- All Grafana Enterprise features
- Self-manage on your own infrastructure
Install on Grafana Cloud
Plugins can be installed directly from within your Grafana instance or automated using the Cloud API or Terraform.
Learn more about plugin installationMarketplace plugins
This is a paid plugin developed by a marketplace partner. To purchase an entitlement, sign in first, then fill out the contact form.
Get this plugin
This is a paid for plugin developed by a marketplace partner. To purchase entitlement please fill out the contact us form.
What to expect:
- Grafana Labs will reach out to discuss your needs
- Payment will be taken by Grafana Labs
- Once purchased the plugin will be available for you to install (cloud) or a signed version will be provided (on-premise)
Thank you! We will be in touch.
For more information, visit the docs on plugin installation.
Installing on a local Grafana:
For local instances, plugins are installed and updated via a simple CLI command. Plugins are not updated automatically, however you will be notified when updates are available right within your Grafana.
1. Install the Data Source
Use the grafana-cli tool to install Zoom from the commandline:
grafana-cli plugins install The plugin will be installed into your grafana plugins directory; the default is /var/lib/grafana/plugins. More information on the cli tool.
Alternatively, you can manually download the .zip file for your architecture below and unpack it into your grafana plugins directory.
Alternatively, you can manually download the .zip file and unpack it into your grafana plugins directory.
2. Configure the Data Source
Accessed from the Grafana main menu, newly installed data sources can be added immediately within the Data Sources section.
Next, click the Add data source button in the upper right. The data source will be available for selection in the Type select box.
To see a list of installed data sources, click the Plugins item in the main menu. Both core data sources and installed data sources will appear.
Changelog
1.0.4
- sign the plugin.
1.0.3
- Added frontend validation for the Associated Meetings query type: Room ID is required by
filterQuery.
1.0.2
- Updated Base URL and Token URL
1.0.1
- Updated README.
1.0.0
- Initial release of the Zoom datasource plugin
- Server-to-Server OAuth authentication with cached token refresh and forced-refresh on 401
- Supported query types:
- Meetings: Details, Meeting QOS, Meeting QOS Series, Participant QOS, Participant QOS Series
- Rooms: Details, Associated Meetings
- Users: Details
- Phones: Details