Plugins 〉Simple OPC-UA


Simple OPC-UA
Simple OPC-UA Data Source for Grafana
A Grafana data source plugin for connecting to OPC-UA servers. Read industrial data directly in Grafana dashboards.
What It Does
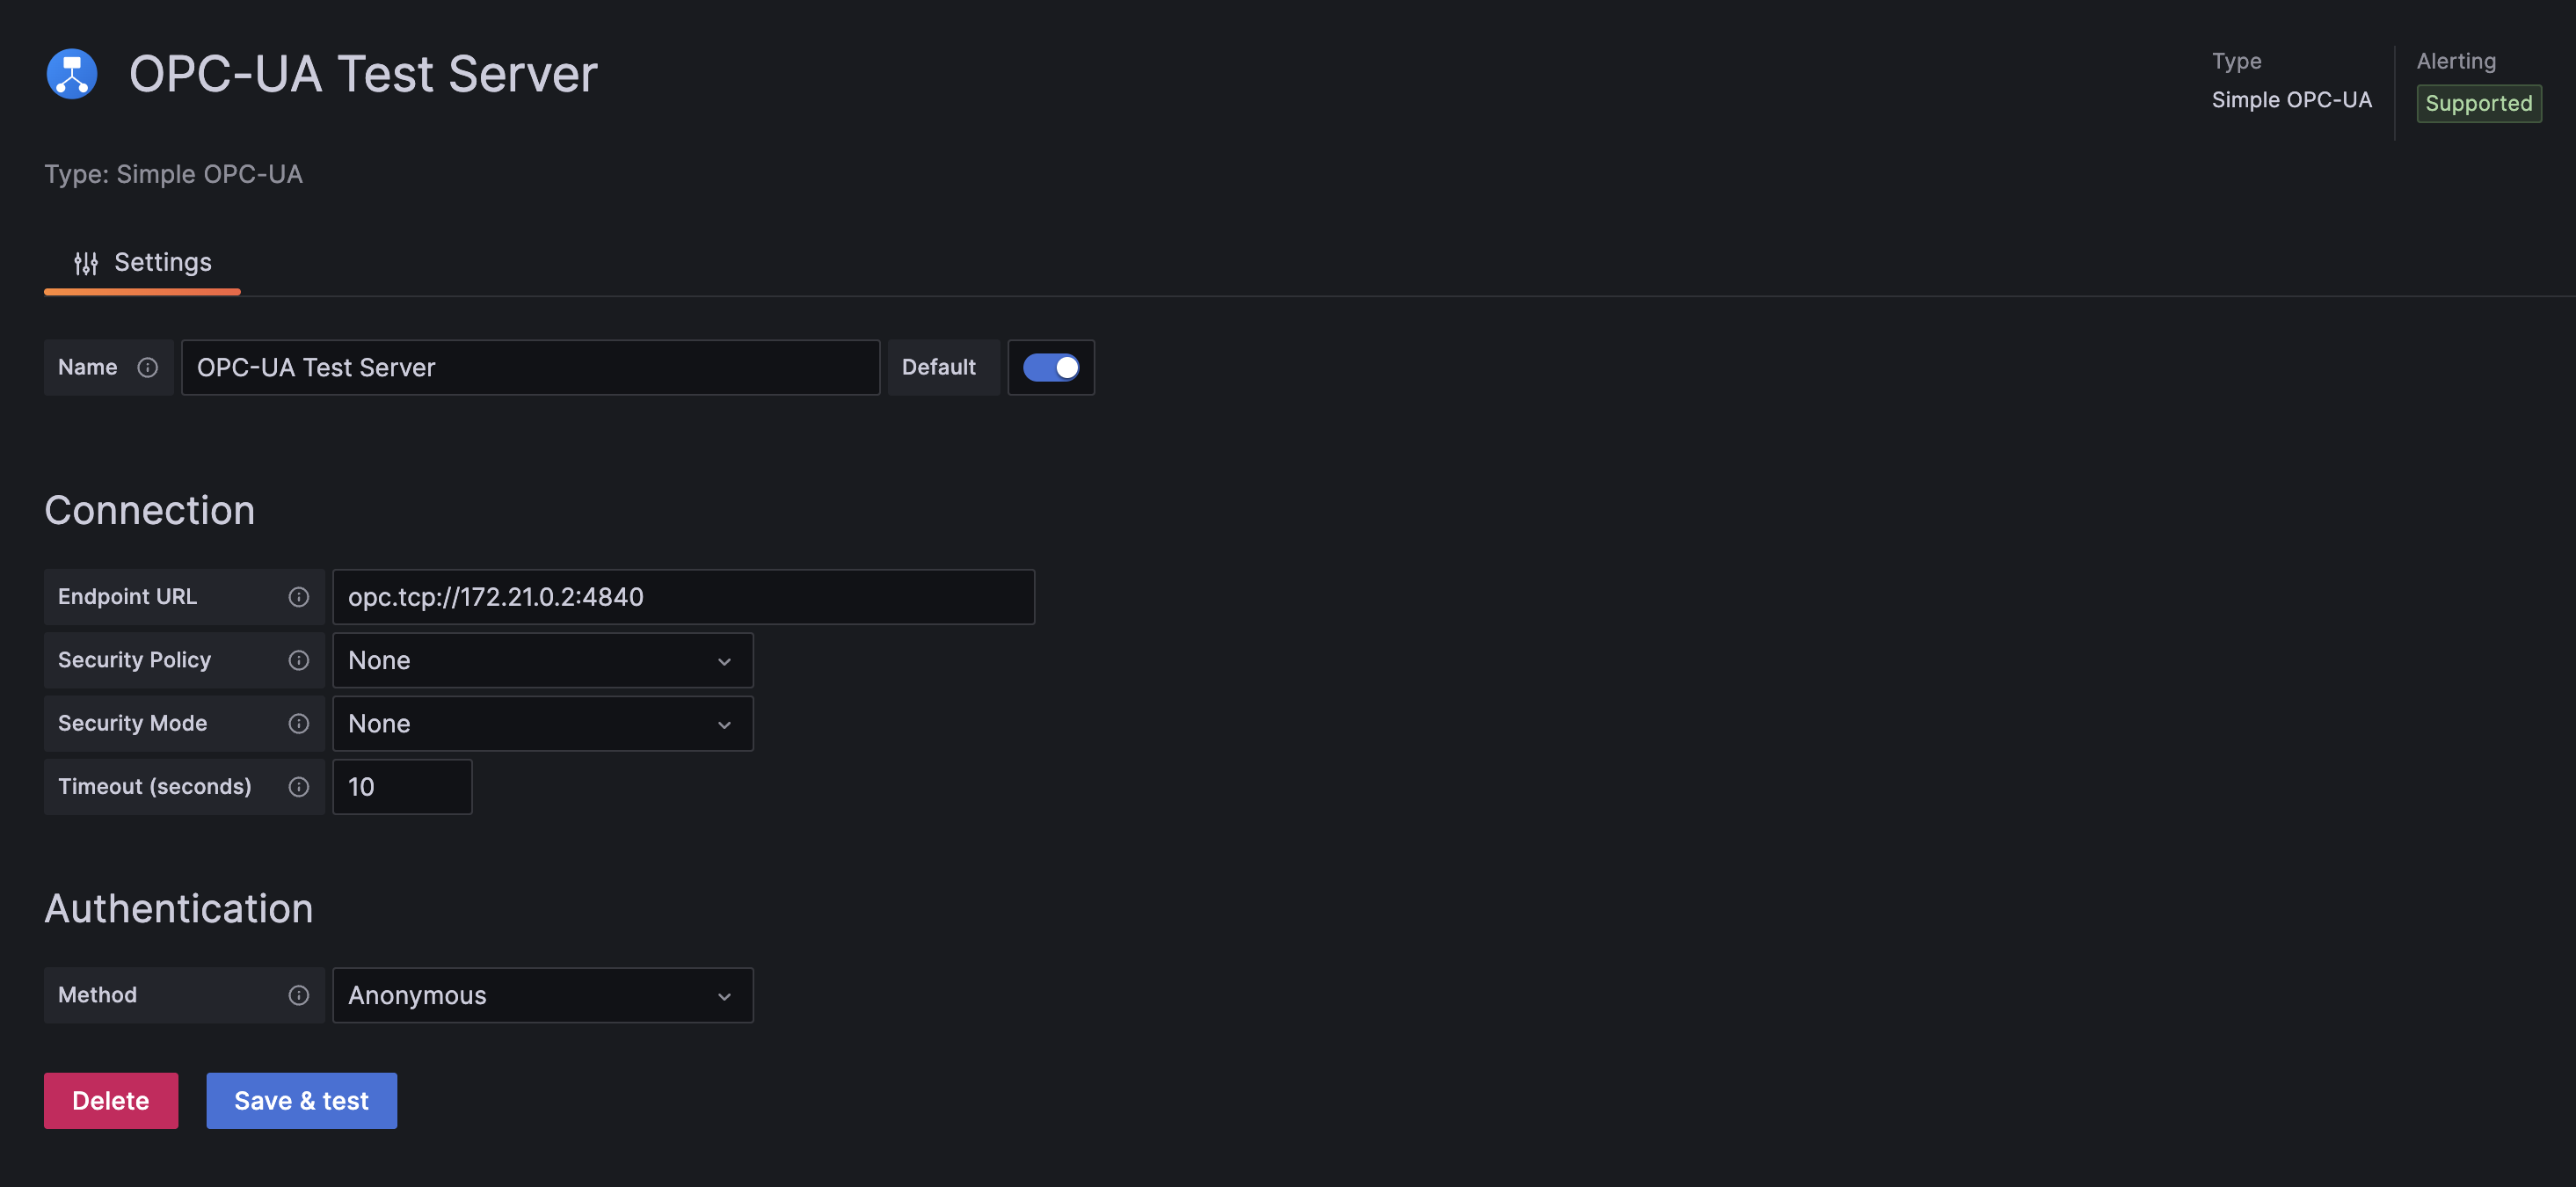
- Easy configuration with endpoint URL, security settings, and authentication
- Multiple auth methods: Anonymous, Username/Password, and Certificate
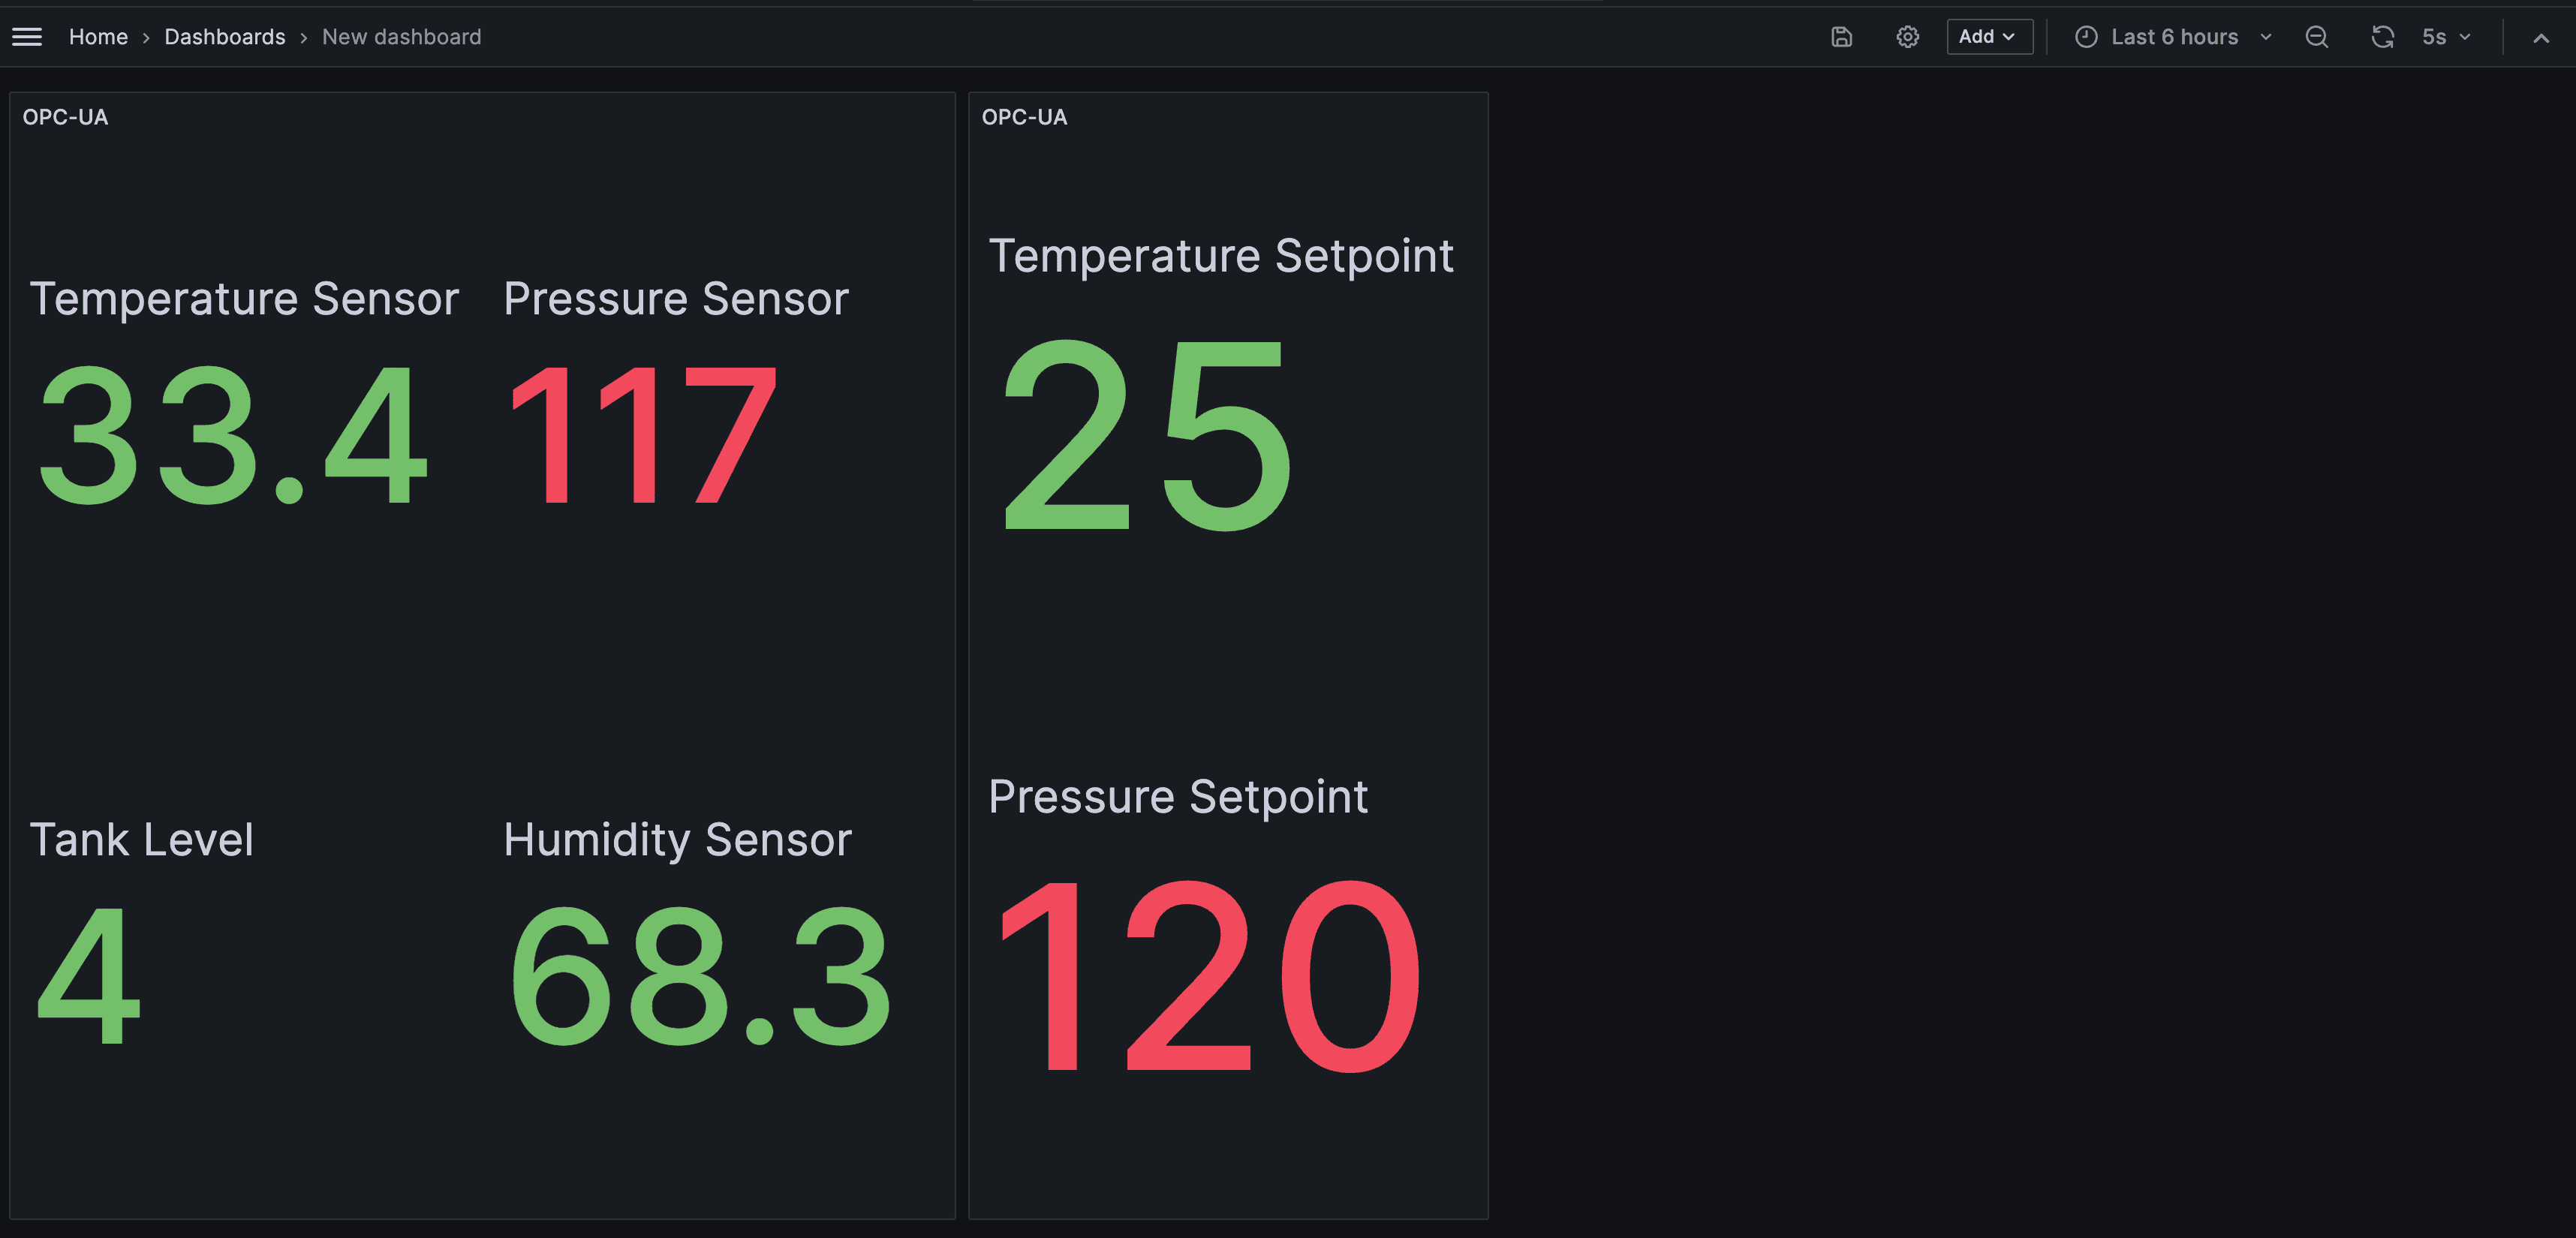
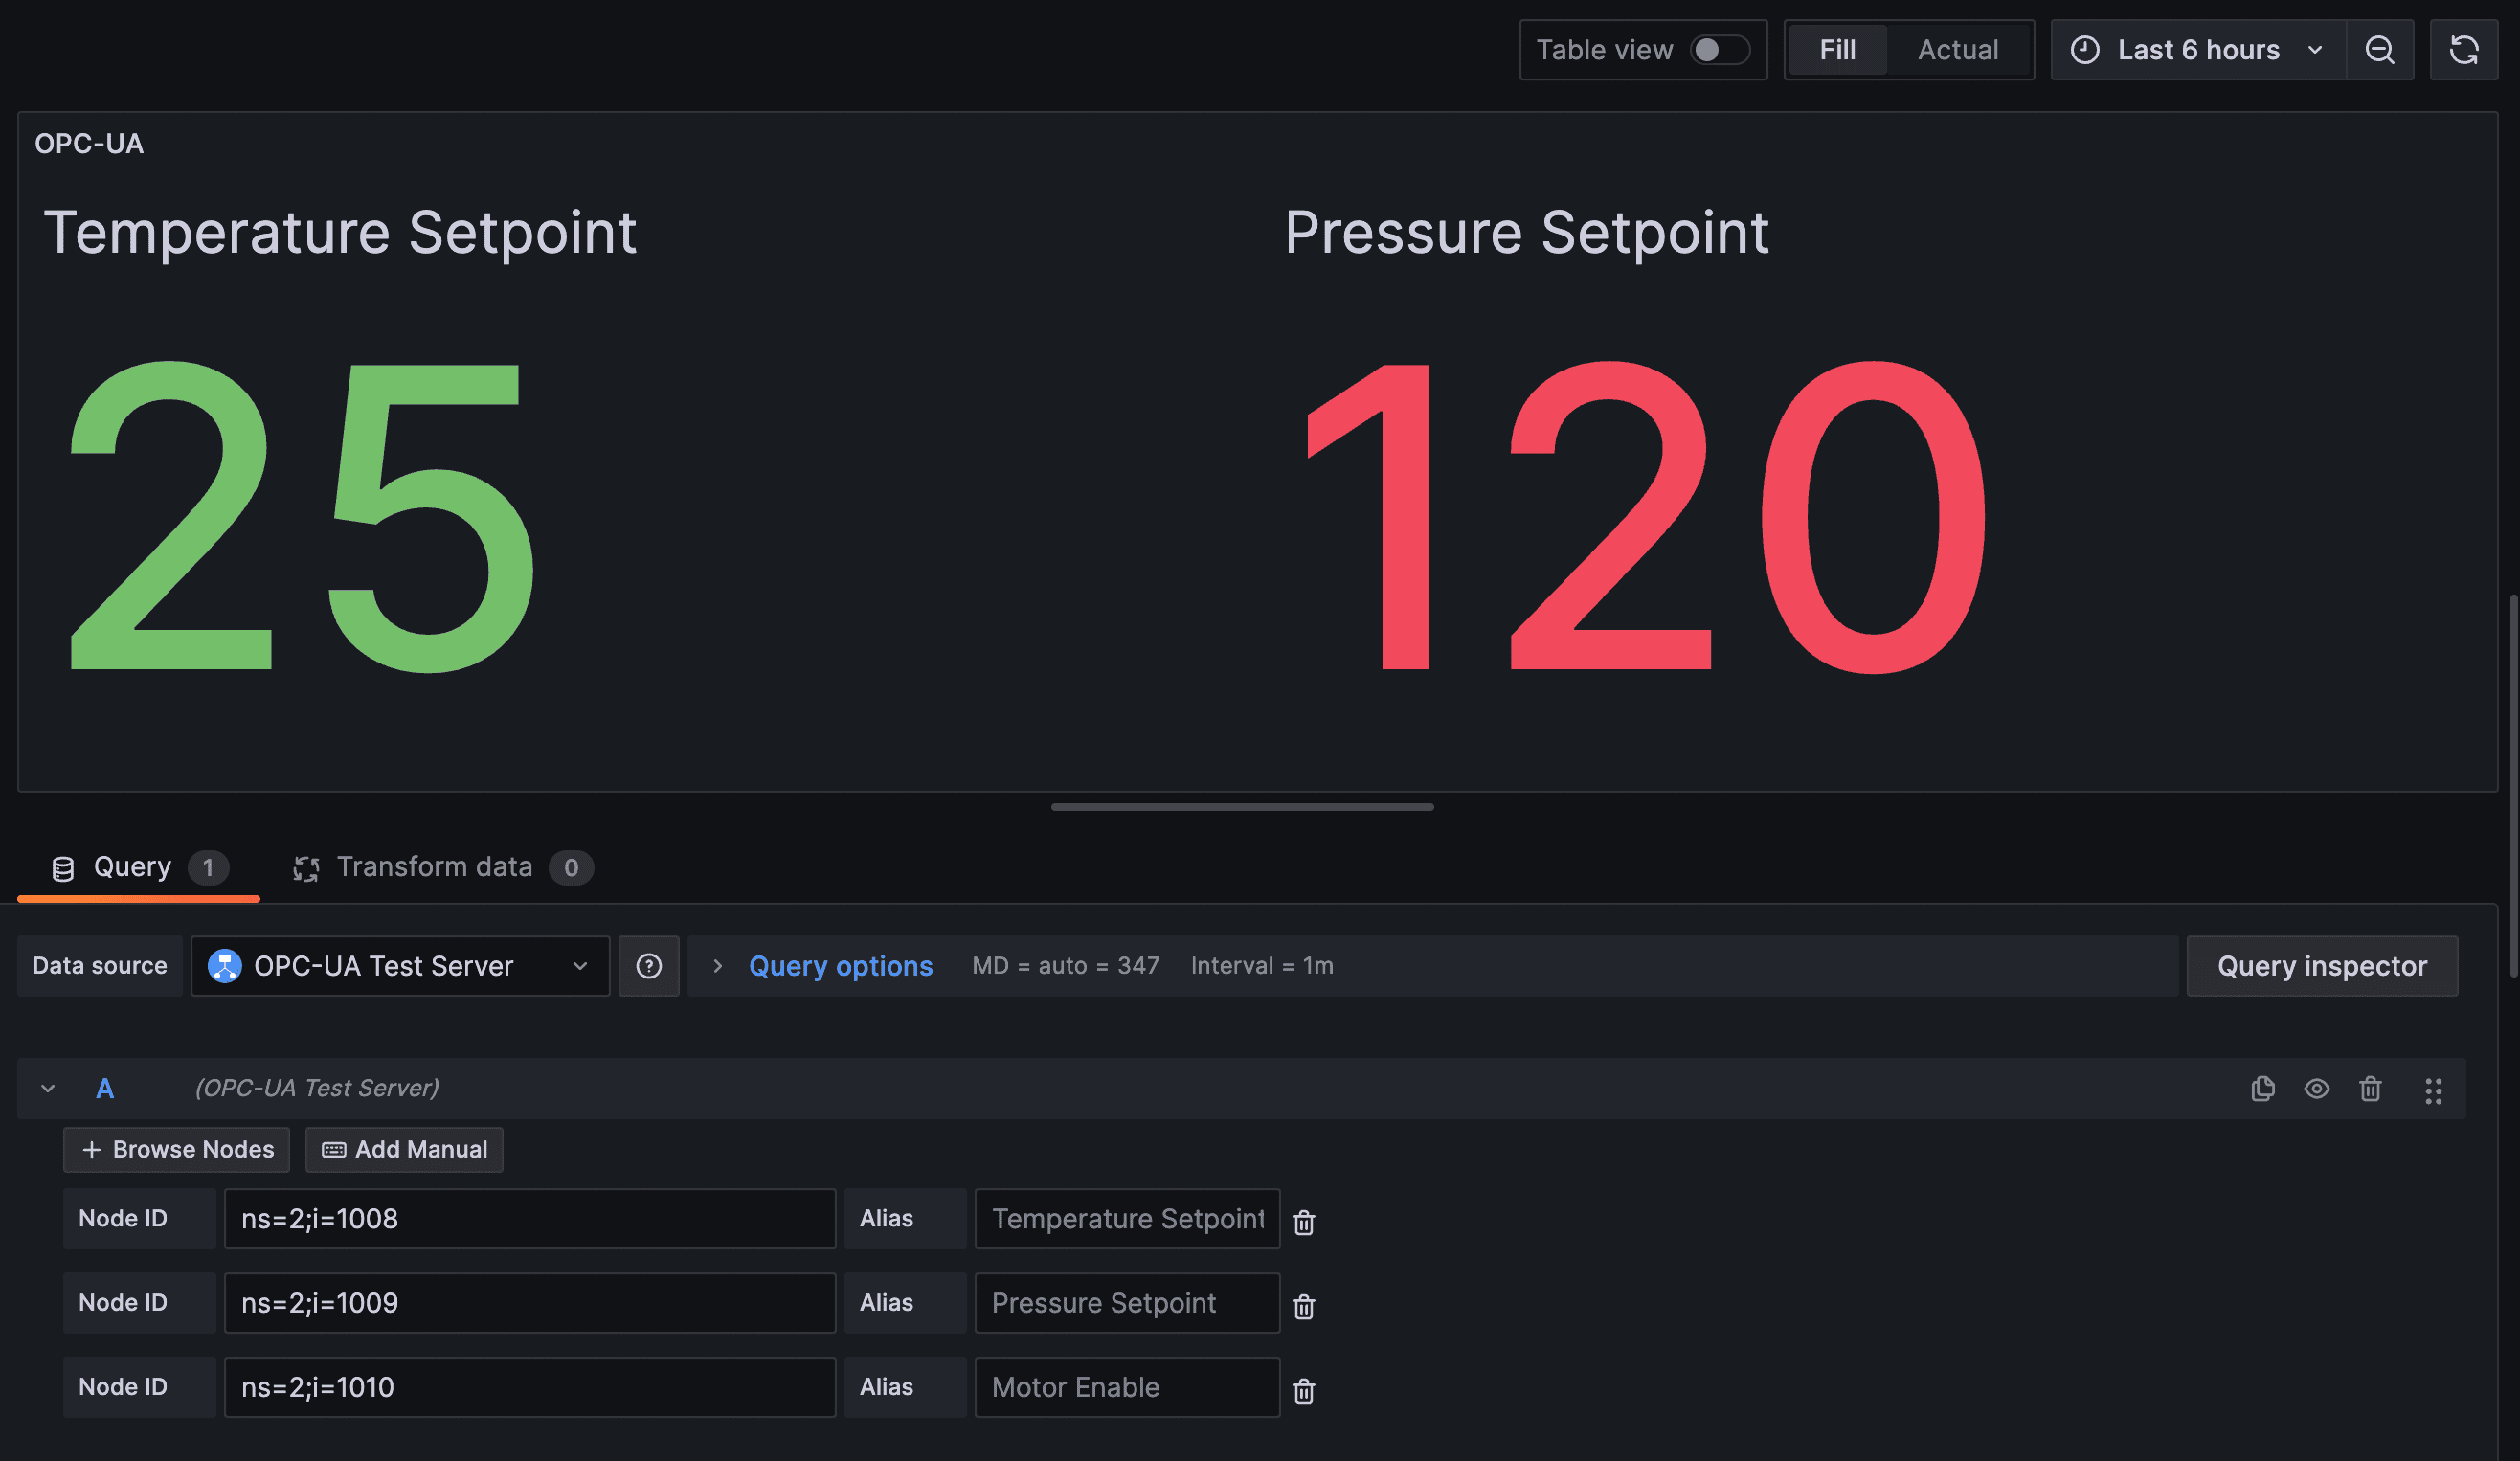
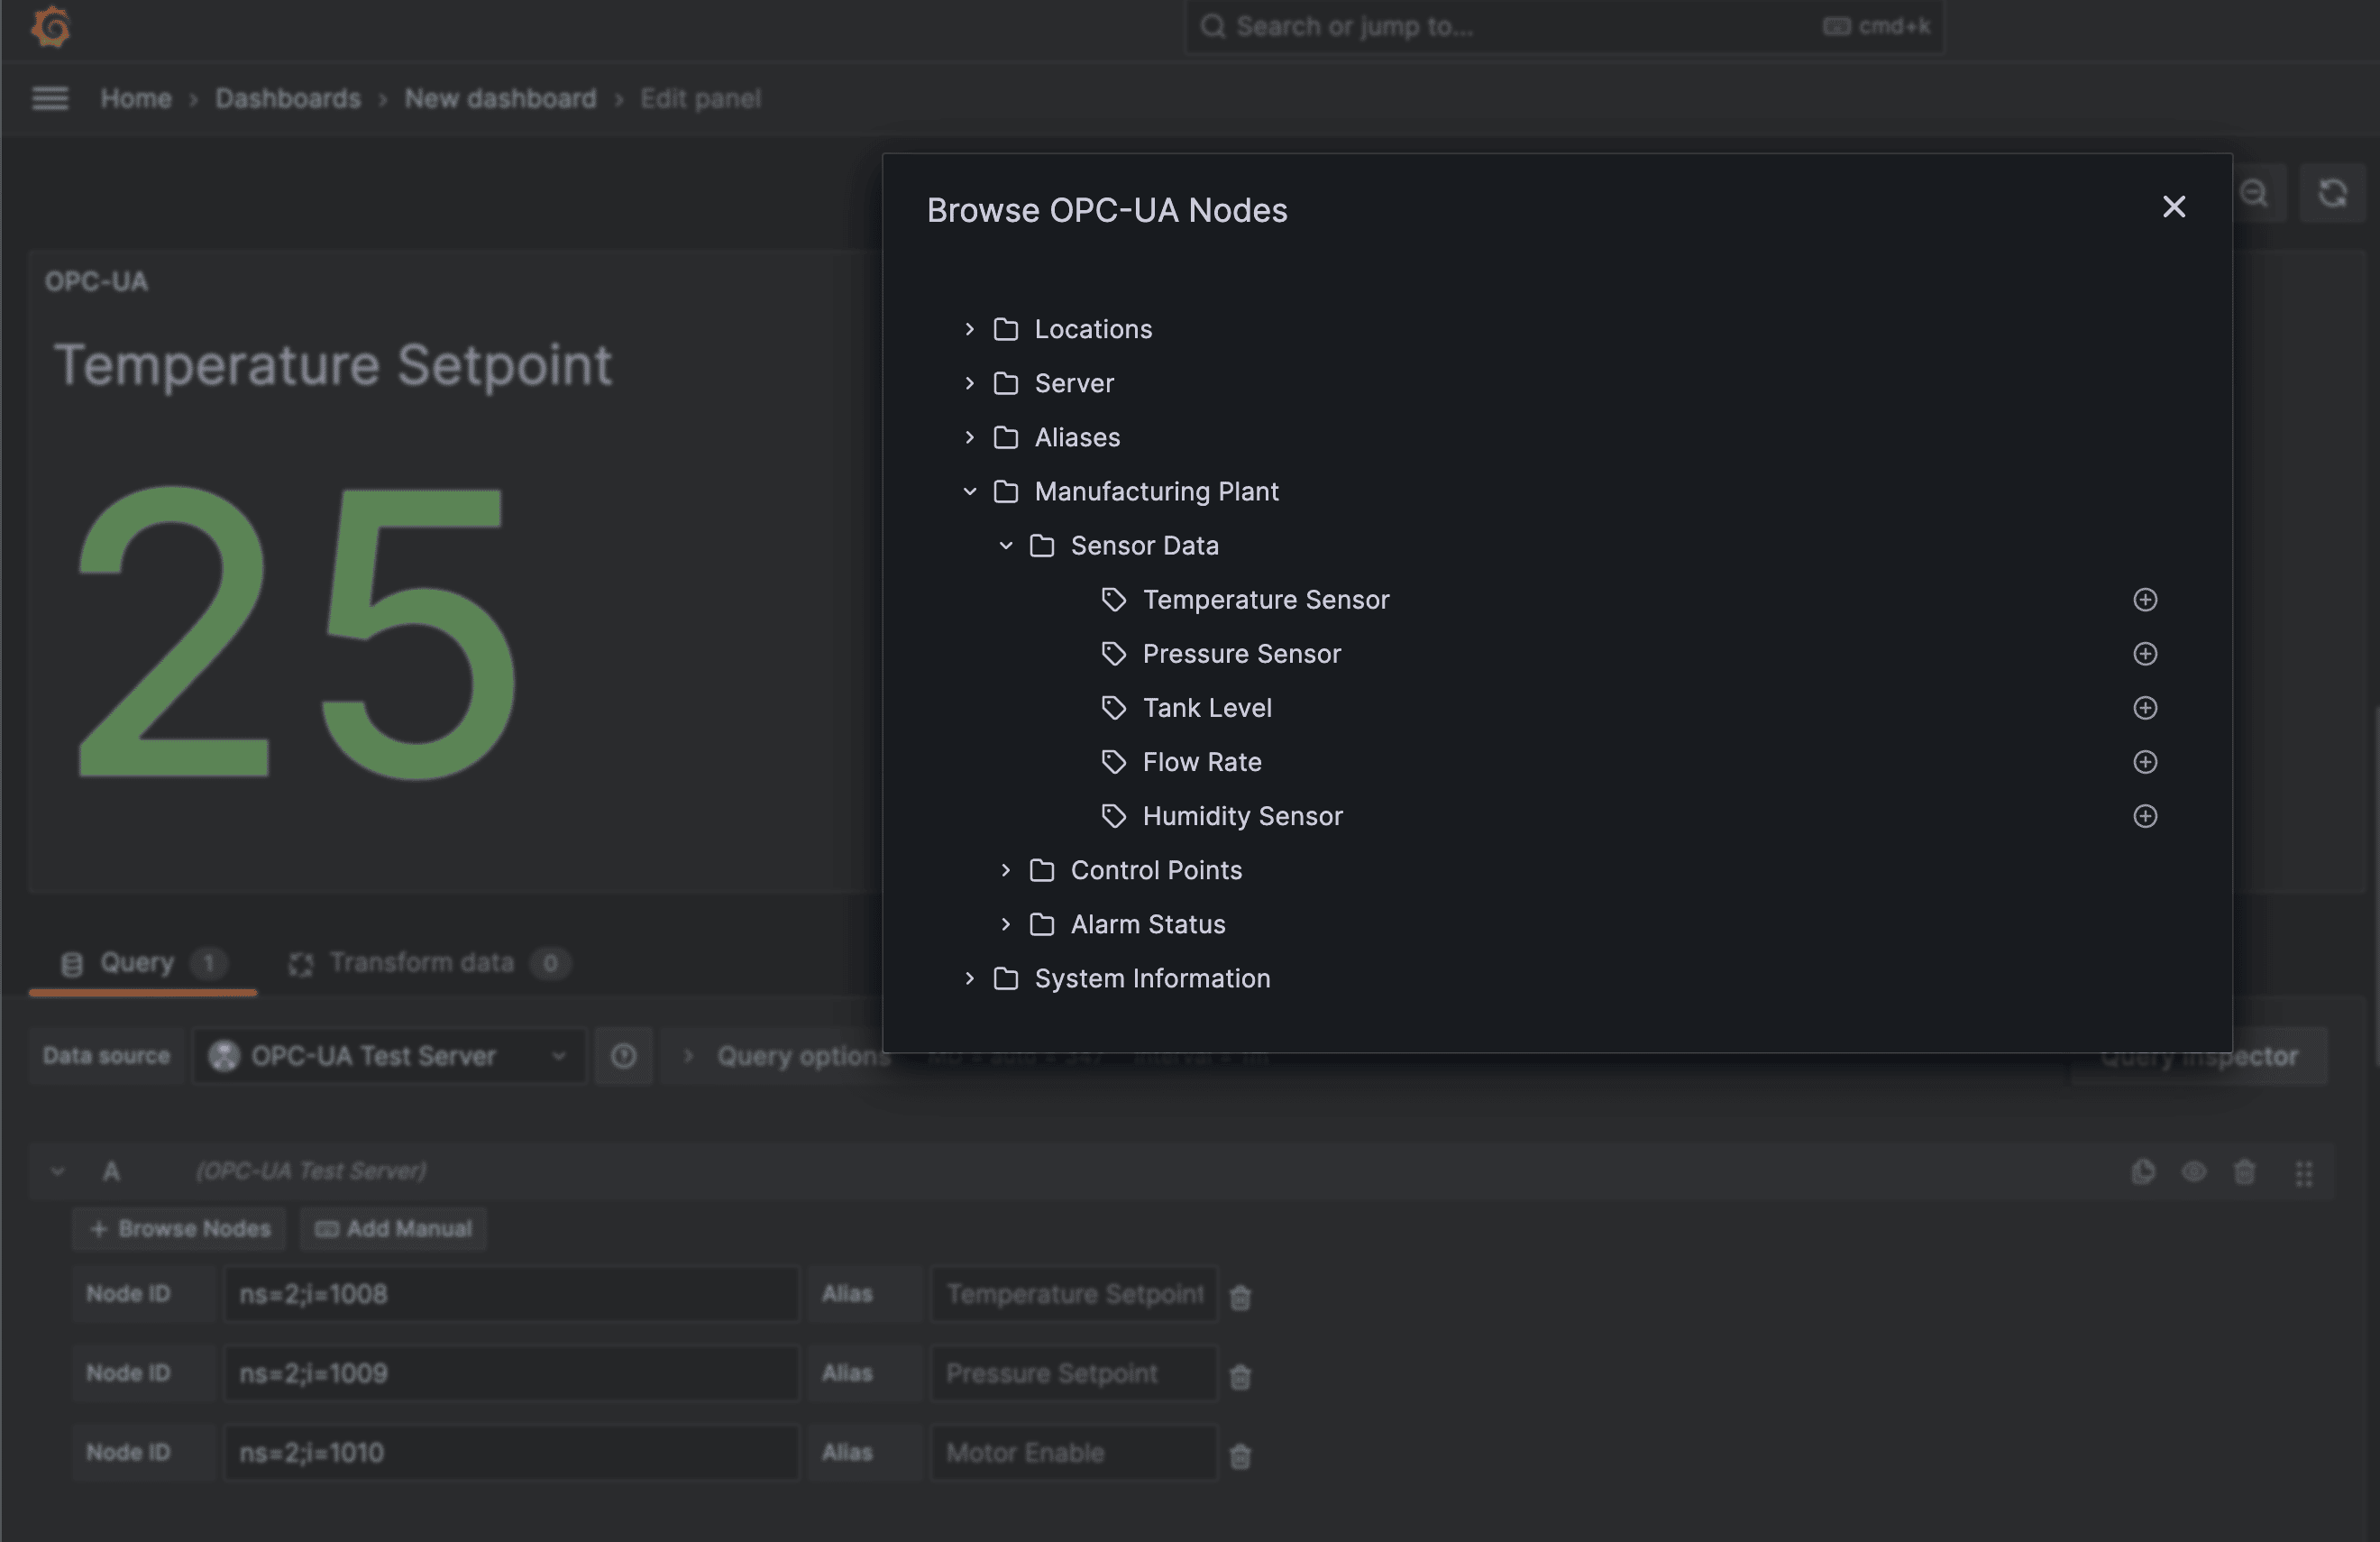
- Graphical node browser for exploring the OPC-UA address space
- Full support for Grafana template variables in Node IDs
- Built-in connection testing via Save & Test
Requirements
- Grafana 10.4.0 or later
- Access to an OPC-UA server
Documentation
| Doc | Description |
|---|---|
| Installation | From catalog, manual install, unsigned plugin setup |
| Configuration | Connection settings, security policies, authentication |
| Usage | Building queries, template variables |
| Development | Build commands, project layout, test servers |
| Testing | Manual testing guide, E2E tests, CI matrix |
| Troubleshooting | Known issues, Grafana 13 quirks, EOF errors |
License
Apache License 2.0. See LICENSE for details.
Support
Grafana Cloud Free
- Free tier: Limited to 3 users
- Paid plans: $55 / user / month above included usage
- Access to all Enterprise Plugins
- Fully managed service (not available to self-manage)
Self-hosted Grafana Enterprise
- Access to all Enterprise plugins
- All Grafana Enterprise features
- Self-manage on your own infrastructure
Install on Grafana Cloud
Plugins can be installed directly from within your Grafana instance or automated using the Cloud API or Terraform.
Learn more about plugin installationMarketplace plugins
This is a paid plugin developed by a marketplace partner. To purchase an entitlement, sign in first, then fill out the contact form.
Get this plugin
This is a paid for plugin developed by a marketplace partner. To purchase entitlement please fill out the contact us form.
What to expect:
- Grafana Labs will reach out to discuss your needs
- Payment will be taken by Grafana Labs
- Once purchased the plugin will be available for you to install (cloud) or a signed version will be provided (on-premise)
Thank you! We will be in touch.
For more information, visit the docs on plugin installation.
Installing on a local Grafana:
For local instances, plugins are installed and updated via a simple CLI command. Plugins are not updated automatically, however you will be notified when updates are available right within your Grafana.
1. Install the Data Source
Use the grafana-cli tool to install Simple OPC-UA from the commandline:
grafana-cli plugins install The plugin will be installed into your grafana plugins directory; the default is /var/lib/grafana/plugins. More information on the cli tool.
Alternatively, you can manually download the .zip file for your architecture below and unpack it into your grafana plugins directory.
Alternatively, you can manually download the .zip file and unpack it into your grafana plugins directory.
2. Configure the Data Source
Accessed from the Grafana main menu, newly installed data sources can be added immediately within the Data Sources section.
Next, click the Add data source button in the upper right. The data source will be available for selection in the Type select box.
To see a list of installed data sources, click the Plugins item in the main menu. Both core data sources and installed data sources will appear.
Changelog
All notable changes to this project will be documented in this file.
The format is based on Keep a Changelog, and this project adheres to Semantic Versioning.
[Unreleased]
[1.1.0] - 2026-05-27
Added
npm run server:devscript for quick local development against a single Grafana version + auth combo (#67)
Fixed
- Client certificate
KeyUsagenow includesContentCommitment(nonRepudiation) per OPC-UA Part 6 §6.2.2. Strict-compliant servers (e.g. ProSys Simulation Server) reject certs without this bit duringOpenSecureChannel, which surfaced asconnect: connect: EOF(#69) - README links in the Documentation table now use absolute GitHub URLs so they resolve when the README is rendered on the Grafana plugin catalog (#76)
Changed
- Documentation reorganized: lean
README.mdwith link table, topical files moved todocs/installation.md,docs/configuration.md,docs/usage.md,docs/development.md,docs/testing.md,docs/troubleshooting.md.CONTRIBUTING.mdis now a redirect stub (#74) - Repo hygiene: untracked ~100MB of accidentally-committed test artifacts and release zips, tightened
.gitignore, archived completed plan files (#72)
Internal
- CI: pinned
golangci-lintto v2.12.2 and bumpedgolangci-lint-actionto v7 for Go 1.25 support (#70, #71)
[1.0.0] - 2026-01-30
Added
- Initial release
- OPC-UA Data Access (DA) support
- Node browsing with tree view
- Anonymous authentication
- Username/Password authentication
- Certificate authentication
- Security policy and mode configuration
- Connection timeout configuration
- Template variable support
- Health check implementation
- Certificate generation UI with "Generate Certificate" button for secure connections
- Client certificates stored in Grafana's encrypted storage (secureJsonData)
- Certificates persist across Grafana restarts and datasource updates
- Certificate status indicator showing configured/not configured state
- Support for Sign and SignAndEncrypt security modes with auto-generated certificates
- GitHub Sponsors link for plugin support
Changed
- Security modes now support certificate auto-generation from the UI
- Certificates are automatically cached during the plugin session for performance
- Certificate lifecycle management - valid for 3 years with automatic renewal when expiring soon