Plugins 〉Parseable


Parseable
Parseable Datasource for Grafana
This data source plugin allows you to query, search and visualize telemetry data stored in Parseable server.
Pre-requisites
Parseable server setup and receiving telemetry data from your application. Read more on Parseable documentation.
Installation
Install the plugin using the Grafana CLI, using the command
grafana-cli plugins install parseable-datasource. Then restart Grafana. Alternatively, you can install the plugin from your Grafana instance (Configuration > Data sources > Add Data source).Add Parseable as a data source at the data source configuration page.
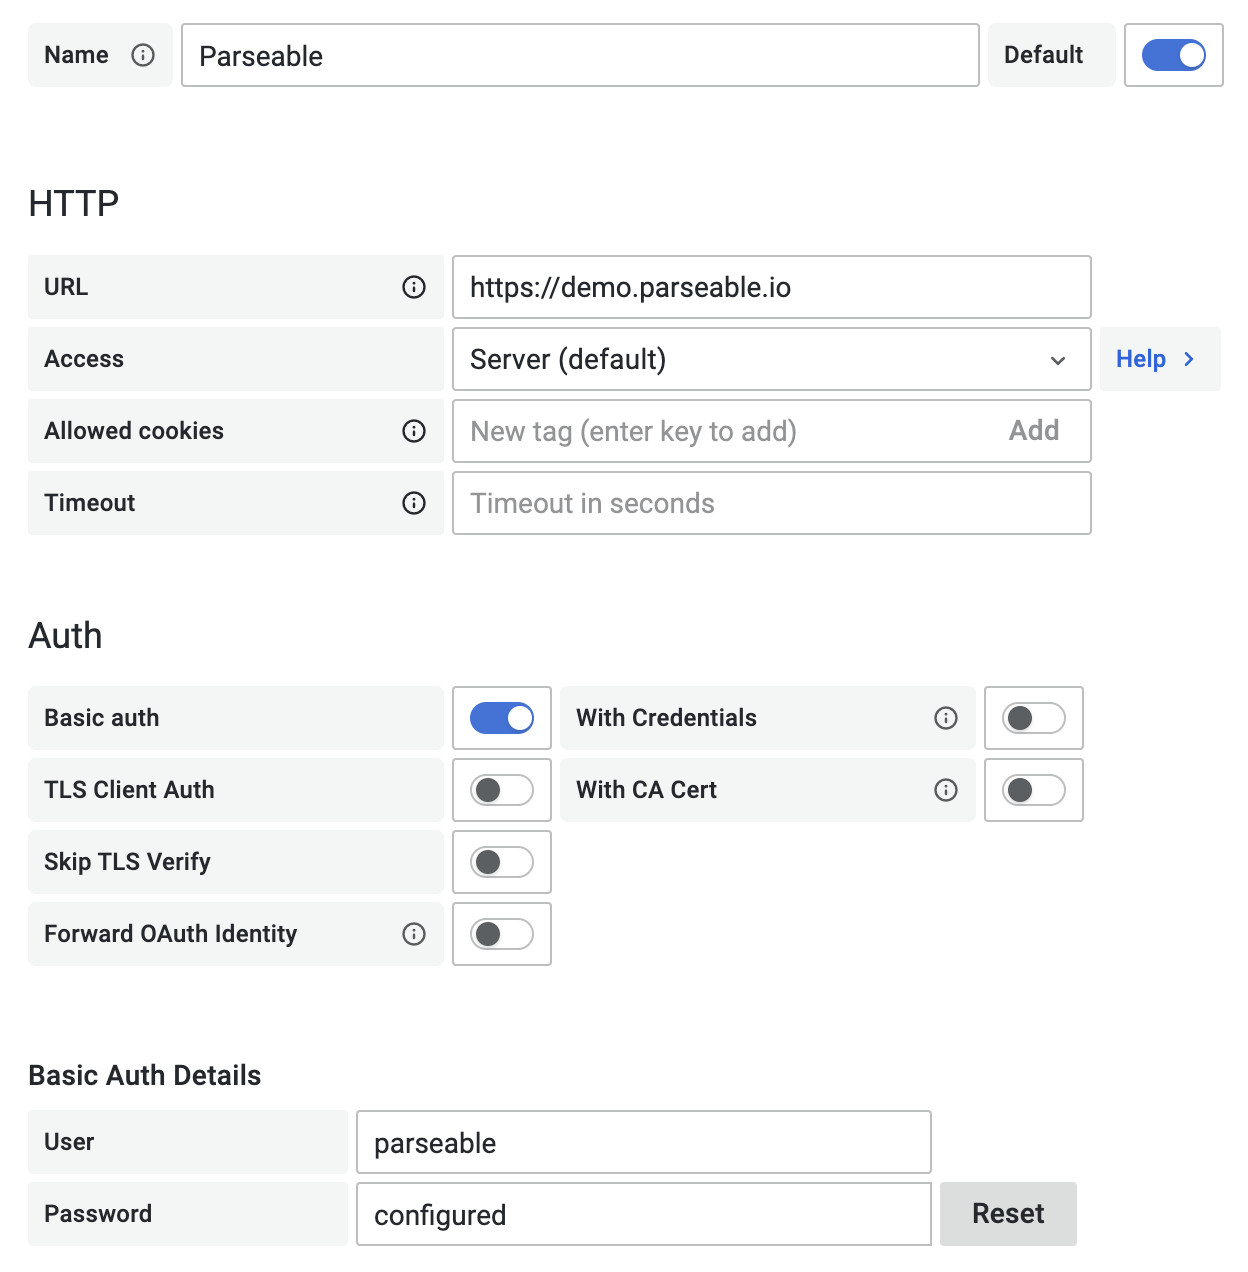
Configure the data source specifying URL and port like https://demo.parseable.com:443. Parseable supports basic auth currently, so toggle the "Basic Auth" option under "Auth" section and enter the username and password under "Basic Auth Details" section. For Parseable demo server use
parseableas both, username and password.Push the
Save and Testbutton, if there is an error message, check the credentials and connection.

Usage
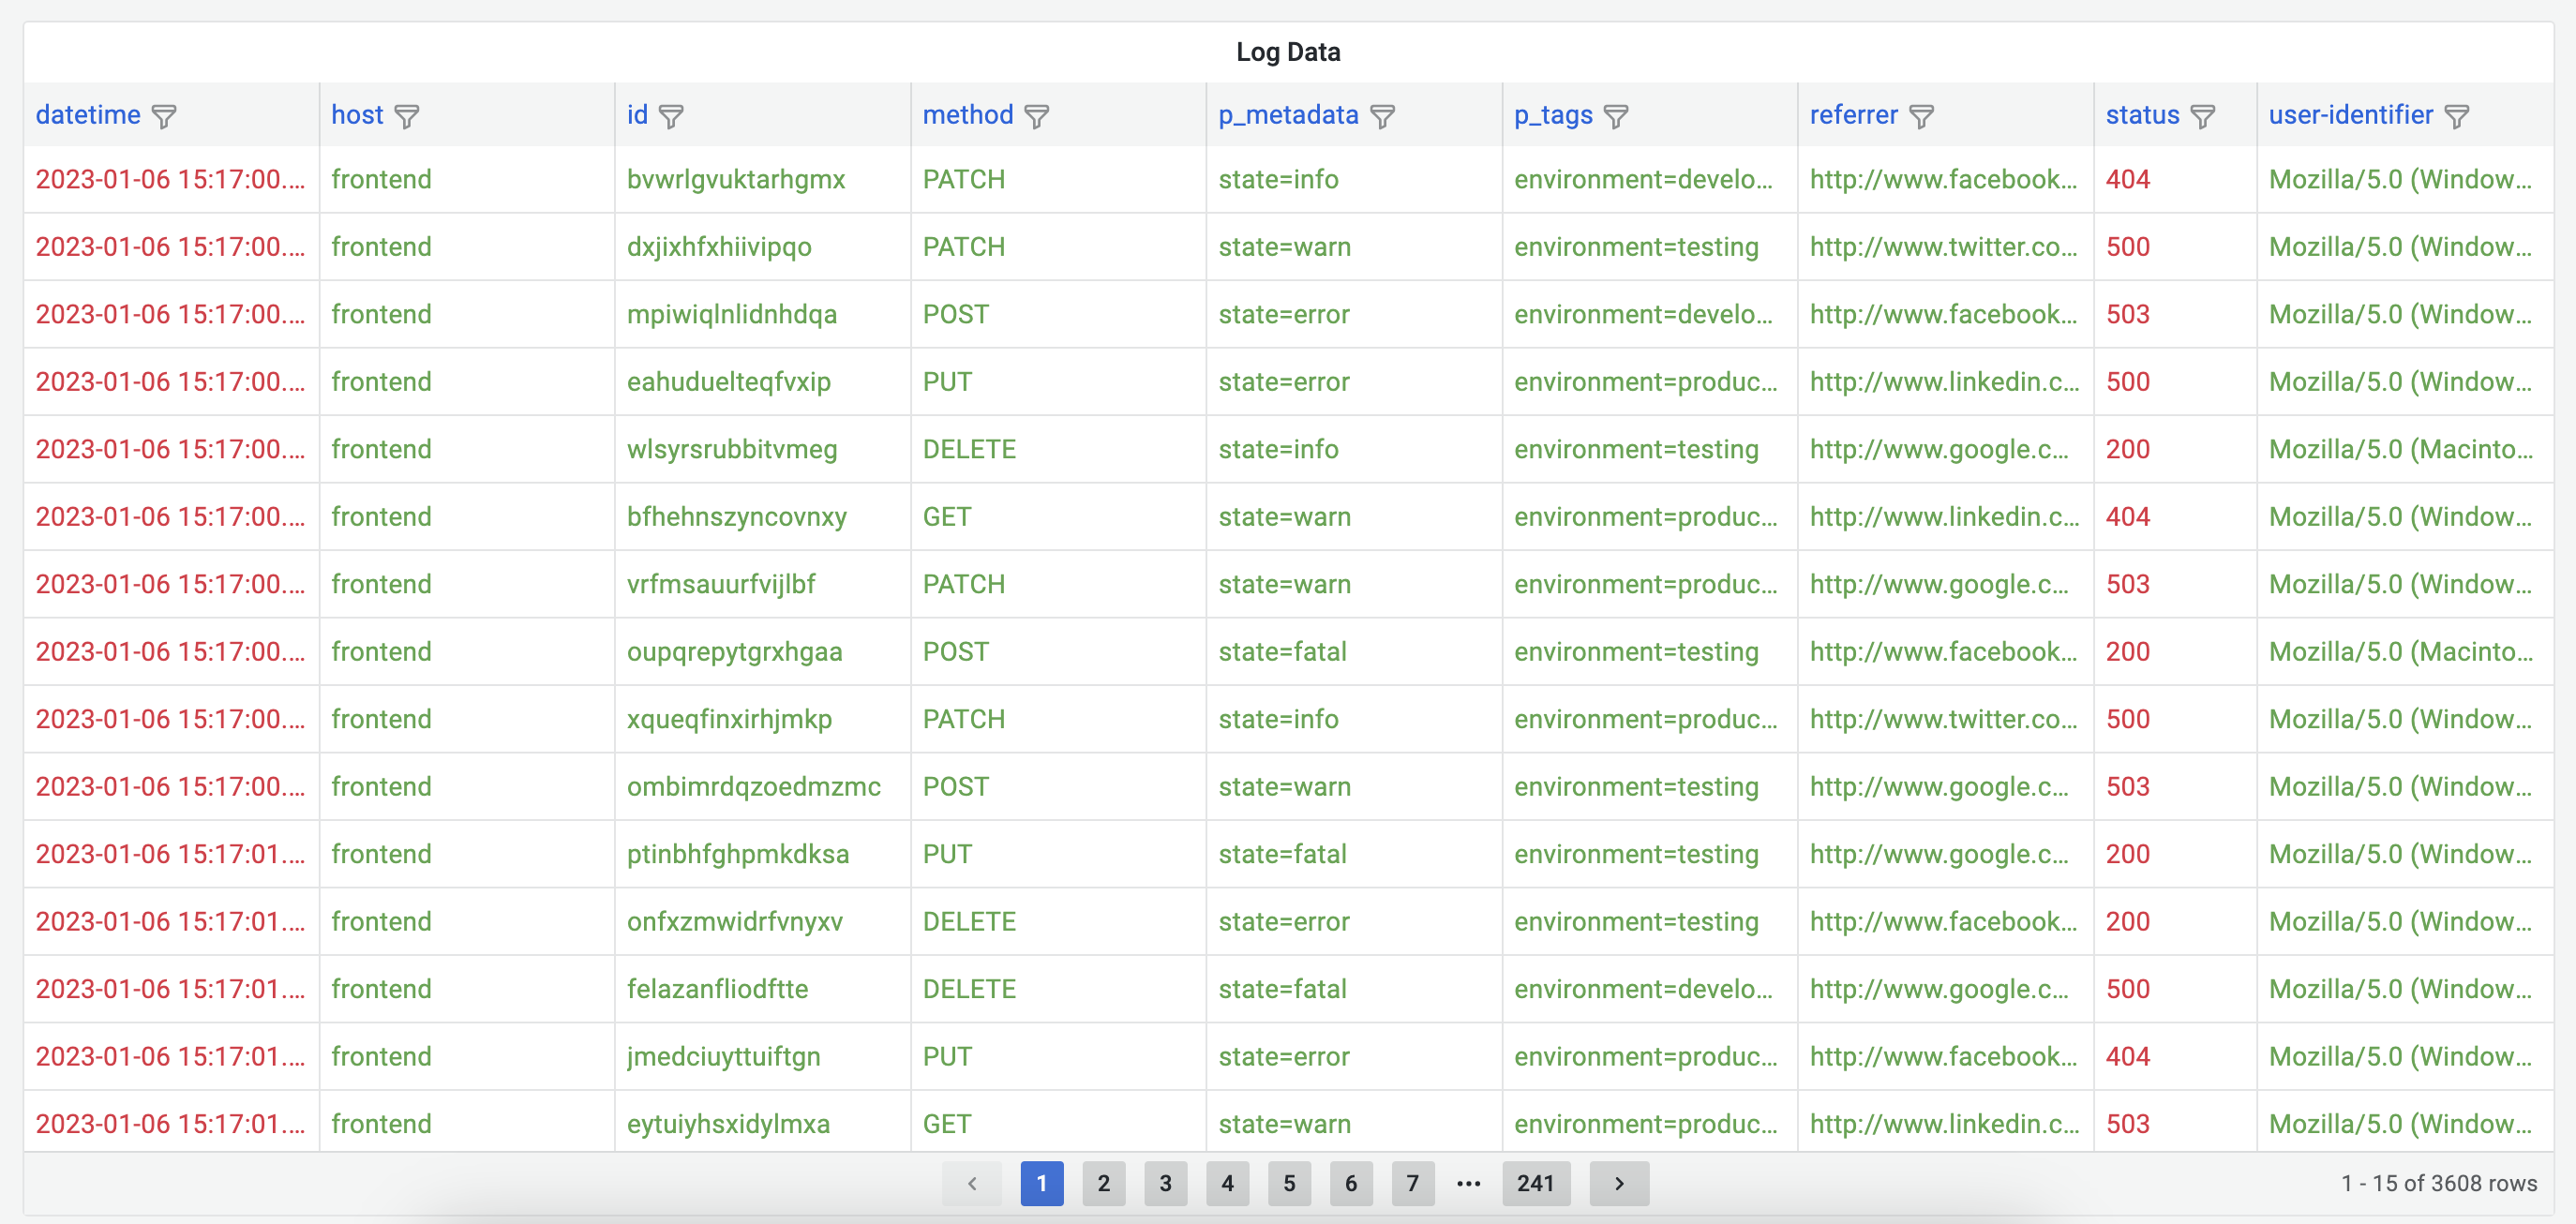
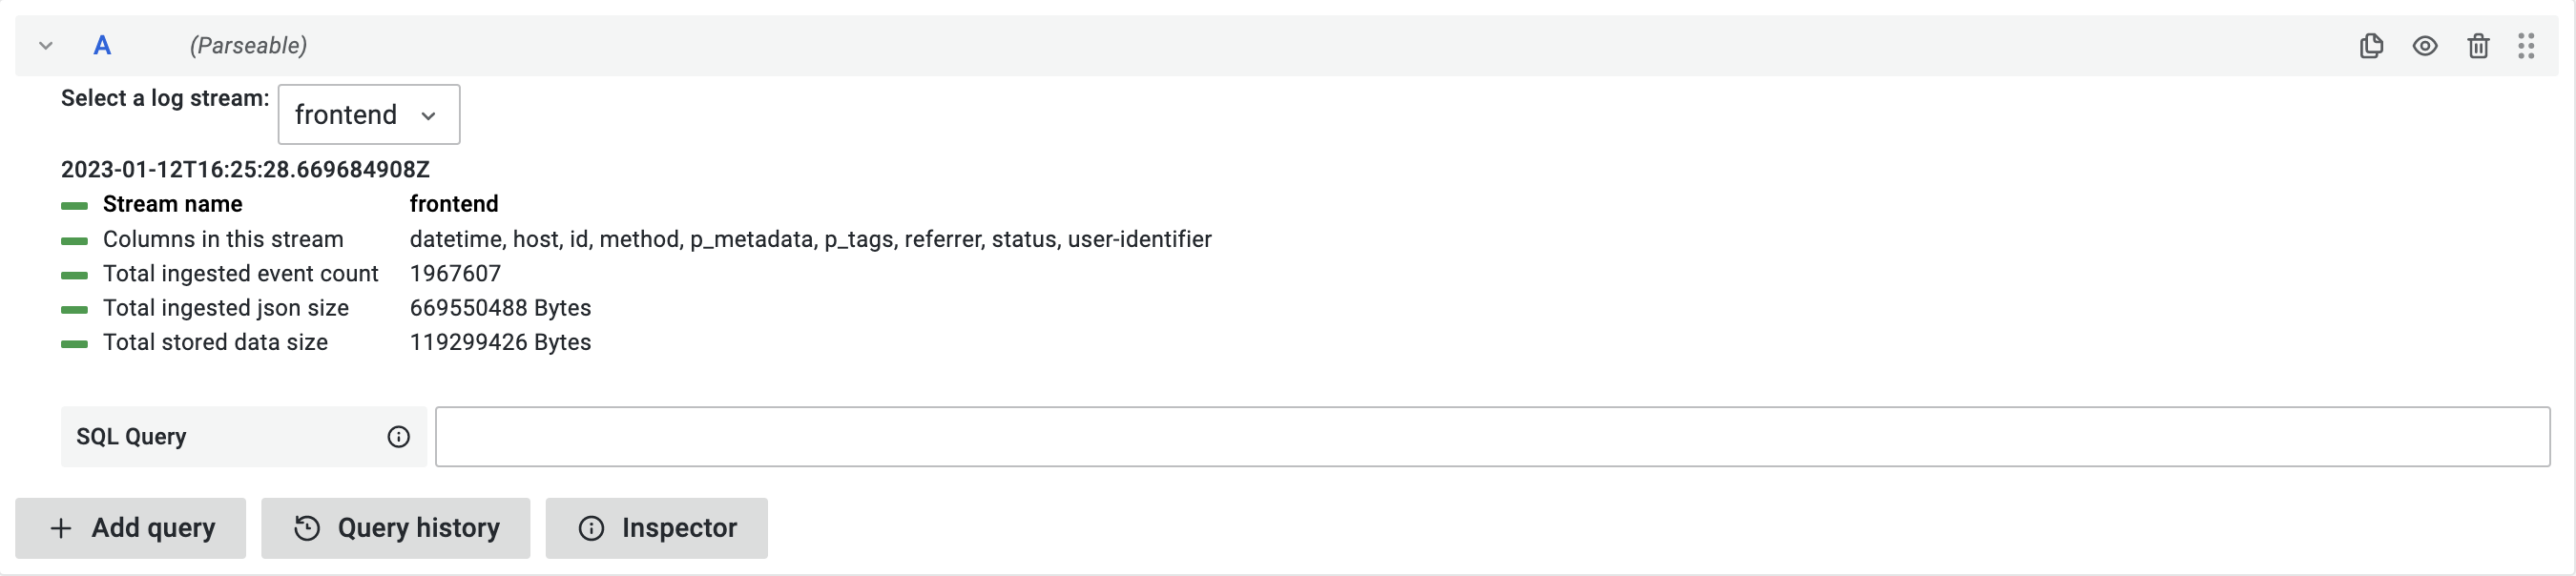
Once the plugin is configured with correct Parseable server instance. You can start using it to query, search and visualize telemetry data stored in Parseable server. You can use the query editor to write your own queries.
Importing Dashboards
This plugin has a a pre-made dashboard called "Parseable Demo Data". You can find it by navigating to the data sources configuration page, selecting the Parseable data source and clicking on the Dashboards tab.
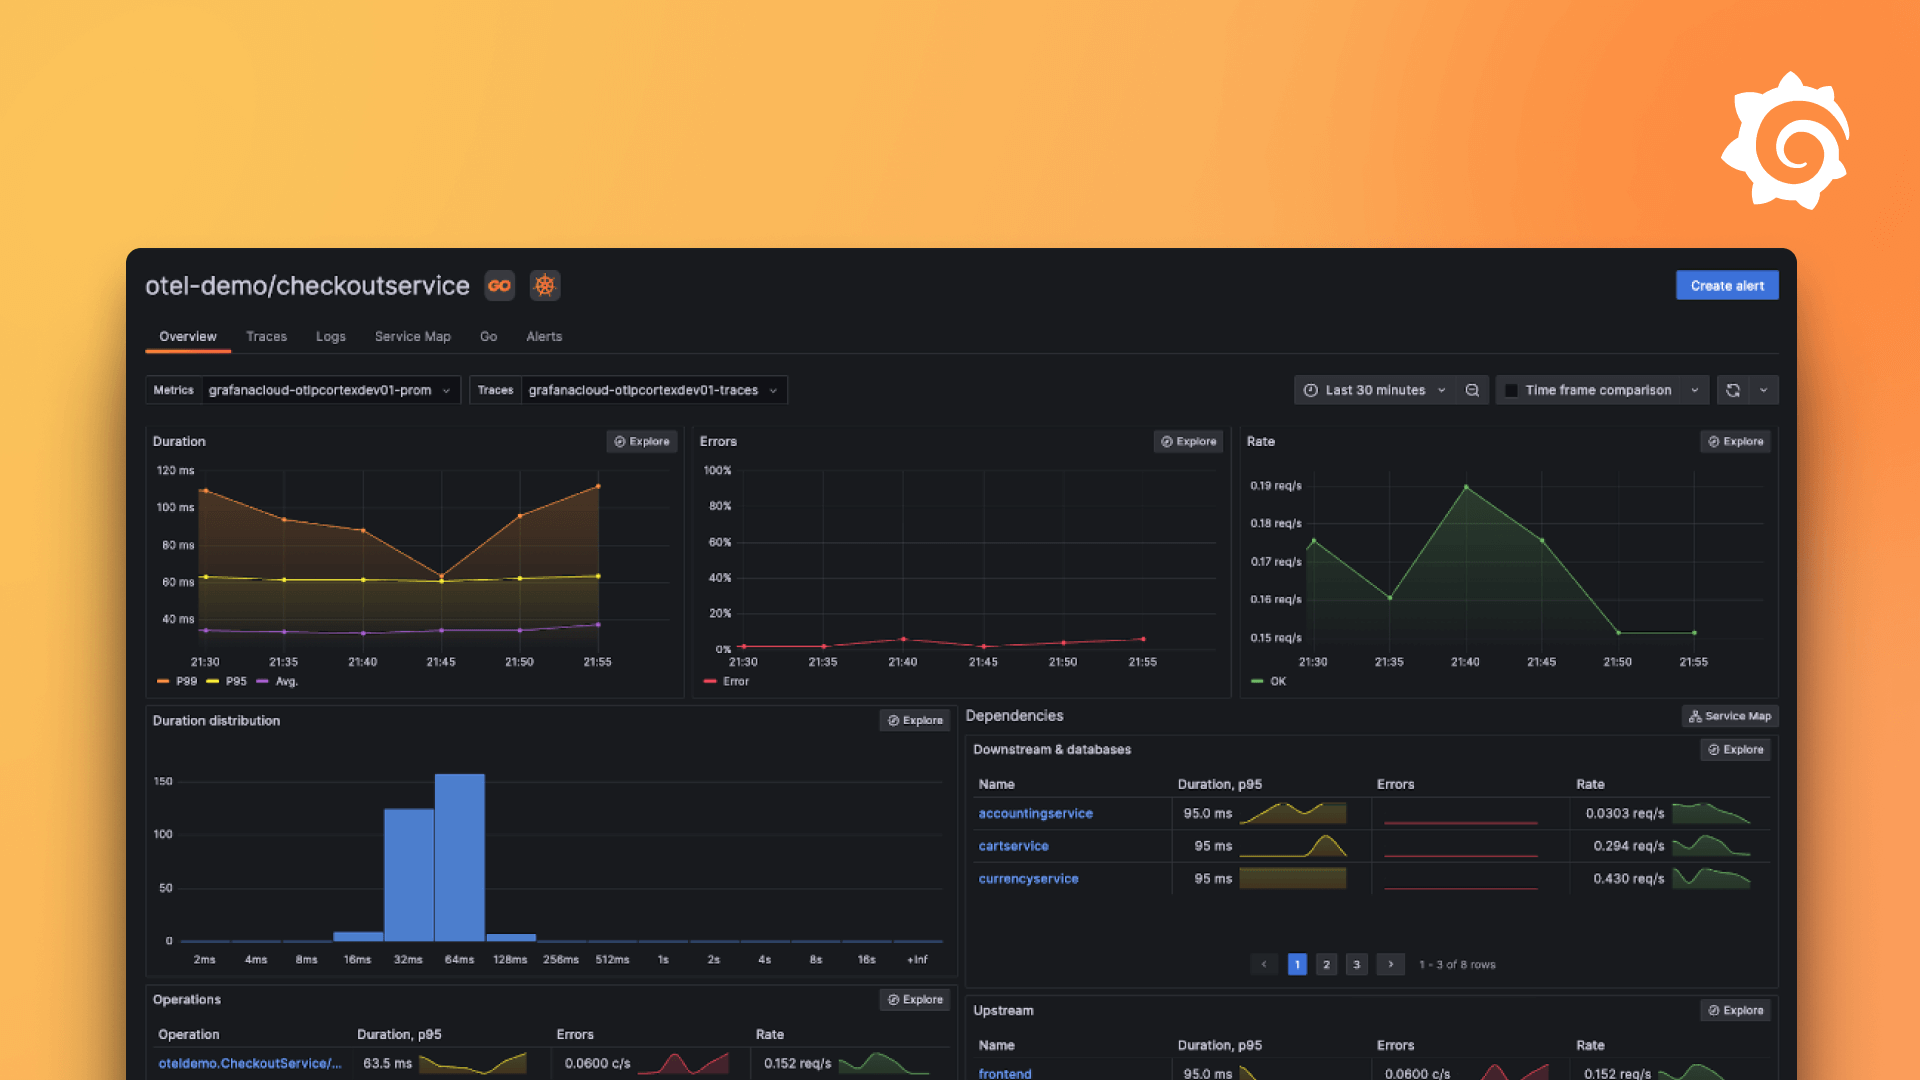
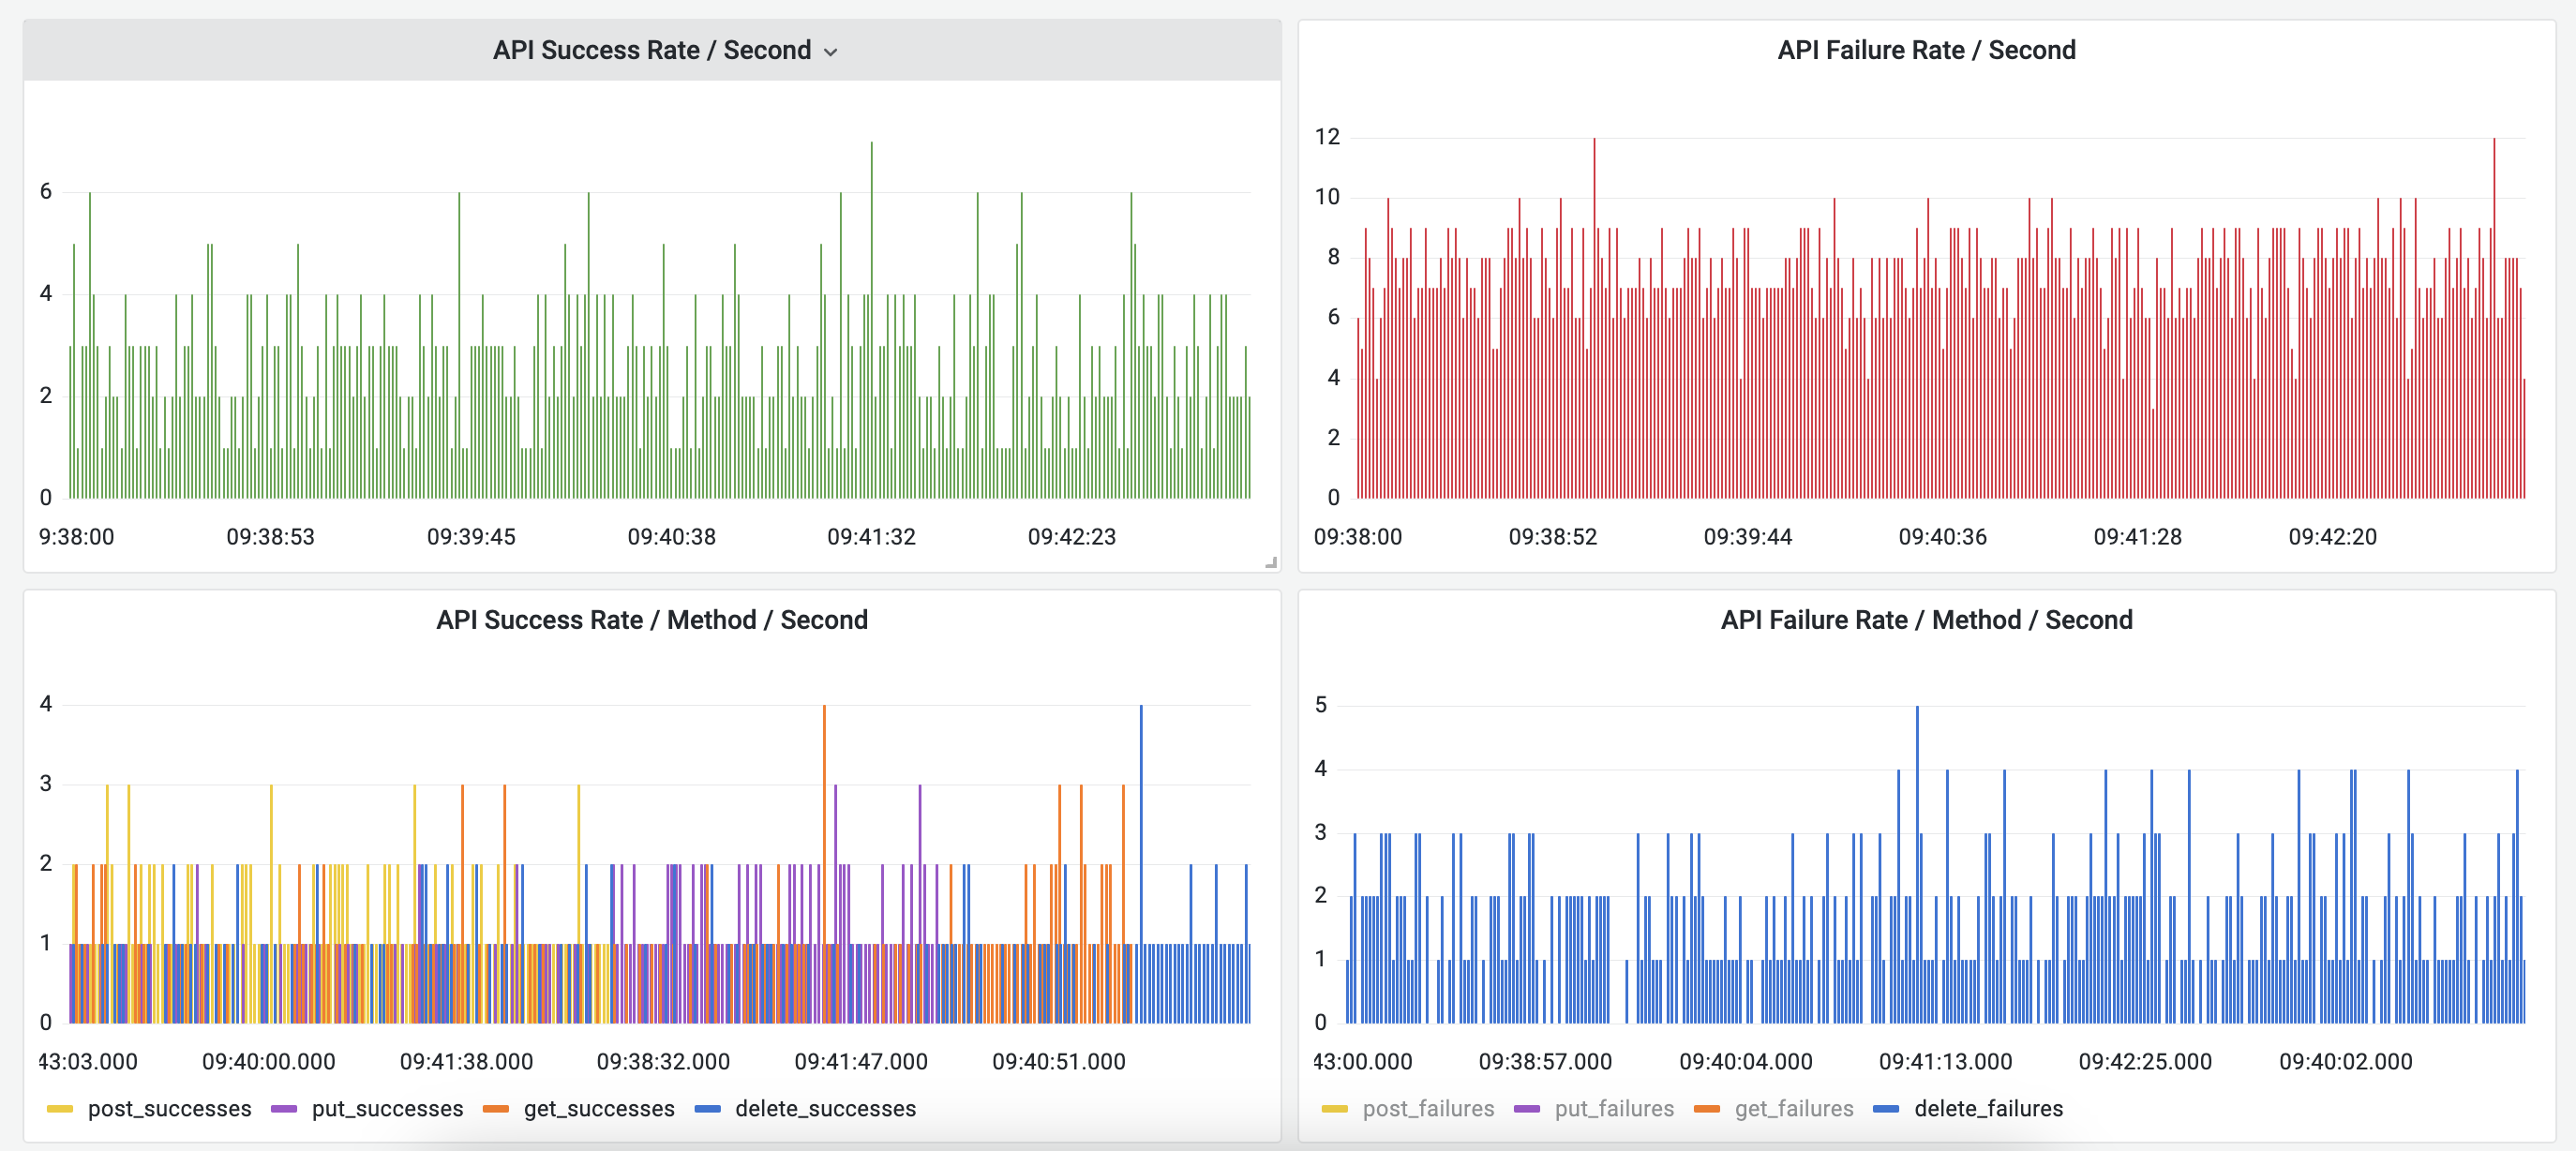
This dashboard is aimed at visualizing the telemetry data stored in the Parseable demo server. You can use it as a starting point for your own dashboards. To use this dashboard, you will need to configure the data source with the Parseable demo server URL https://demo.parseable.com and credentials admin, admin.
Screenshots


Grafana Cloud Free
- Free tier: Limited to 3 users
- Paid plans: $55 / user / month above included usage
- Access to all Enterprise Plugins
- Fully managed service (not available to self-manage)
Self-hosted Grafana Enterprise
- Access to all Enterprise plugins
- All Grafana Enterprise features
- Self-manage on your own infrastructure
Install on Grafana Cloud
Plugins can be installed directly from within your Grafana instance or automated using the Cloud API or Terraform.
Learn more about plugin installationMarketplace plugins
This is a paid plugin developed by a marketplace partner. To purchase an entitlement, sign in first, then fill out the contact form.
Get this plugin
This is a paid for plugin developed by a marketplace partner. To purchase entitlement please fill out the contact us form.
What to expect:
- Grafana Labs will reach out to discuss your needs
- Payment will be taken by Grafana Labs
- Once purchased the plugin will be available for you to install (cloud) or a signed version will be provided (on-premise)
Thank you! We will be in touch.
For more information, visit the docs on plugin installation.
Installing on a local Grafana:
For local instances, plugins are installed and updated via a simple CLI command. Plugins are not updated automatically, however you will be notified when updates are available right within your Grafana.
1. Install the Data Source
Use the grafana-cli tool to install Parseable from the commandline:
grafana-cli plugins install The plugin will be installed into your grafana plugins directory; the default is /var/lib/grafana/plugins. More information on the cli tool.
Alternatively, you can manually download the .zip file for your architecture below and unpack it into your grafana plugins directory.
Alternatively, you can manually download the .zip file and unpack it into your grafana plugins directory.
2. Configure the Data Source
Accessed from the Grafana main menu, newly installed data sources can be added immediately within the Data Sources section.
Next, click the Add data source button in the upper right. The data source will be available for selection in the Type select box.
To see a list of installed data sources, click the Plugins item in the main menu. Both core data sources and installed data sources will appear.
Changelog
v2.0.0 (2026-05-18)
Undefined field handling #44
chore: upgrade deps + fix Grafana plugin validation issues #55 (praveen5959)
feat: paginated value suggestions via dataset_stats with top-5 + show more #53 (praveen5959)
Prom ql builder #52 (praveen5959)
feat: PromQL-first with full Code-mode feature parity #51 (praveen5959)
Upgrade Grafana SDK to 12.x, modernize build and CI #50 (praveen5959)
Update branding: replace logo and update terminology from logs to telemetry data #49 (Debanitrkl)
fixed plugin validation error: renamed root dir - from 'dist' to plugin-id #47 (balaji-jr)
v1.2.1 (2024-06-11)
- Refactor + Fix for making table headers #45 (balaji-jr)
- plugin sdk upgrade #43 (balaji-jr)
- use auth'd endpoint to test connection #42 (balaji-jr)
v1.2.0 (2024-03-14)
Grafana 10 support #26
Update fix for edge case in query and add alerting feature #38 (nitisht)
feat: add backend plugin to make alerting possible #37 (stanvanrooy)
fix: handle invalid initial value in variable formatter #36 (stanvanrooy)
feat: handle query interpolation multi-valued variable #32 (stanvanrooy)
feat: add support for dynamic variables from parseable #31 (stanvanrooy)
v1.1.0 (2023-06-18)
- Update plugin to support Grafana 10 #30 (nitisht)
- feat: show if error happens while querying #29 (stanvanrooy)
- feat: make variables used in queries work #28 (stanvanrooy)
- Add cla.yaml #27 (nitisht)
- Update docs #25 (nitisht)
- Optimise to avoid looping over the response #24 (nitisht)
- Fix type guess #23 (nitisht)
- Remove commented code and update min reqd version #22 (nitisht)
- Fix listing in dashboard panels #21 (nitisht)
- Fix plugin version #20 (nitisht)
- Use send_null flag while sending queries #19 (nitisht)
- Add credits #18 (nitisht)
- Fix comments and sign the plugin #17 (nitisht)
- Fix plugin ID as per Grafana spec #16 (nitisht)
- Fix timestamp type parsing #15 (nitisht)
- Remove manual time type check #14 (nitisht)
- Add more details in the query editor #13 (nitisht)
- Add details about stream in the query editor #12 (nitisht)
- made UI changes to the query editor #11 (abhishek1305)
- Fix readme #10 (nitisht)
- Update the release #8 (nitisht)
- Add dashboard and screenshots #7 (nitisht)
- Create separate release dir and add shasum #6 (nitisht)
- Fix links in readme and add more info in plugin.json #5 (nitisht)
- Add CI and documentation #4 (nitisht)
- Prepare for plugin release #3 (nitisht)
- Use p_timestamp as the field to be used as time #2 (nitisht)
- Cleanup tooltip and expand the size of query editor #1 (nitisht)
* This Changelog was automatically generated by github_changelog_generator