

GrafanaでIBM MQを簡単に監視
Grafana Cloudのすぐに使える監視ソリューションを使用して、さまざまな環境にデプロイできるメッセージキューソフトウェアであるIBM MQを簡単に監視できます。Grafana Cloudの永年無料枠には、監視ニーズをサポートするために3ユーザーと最大10,000メトリクスシリーズが含まれています。
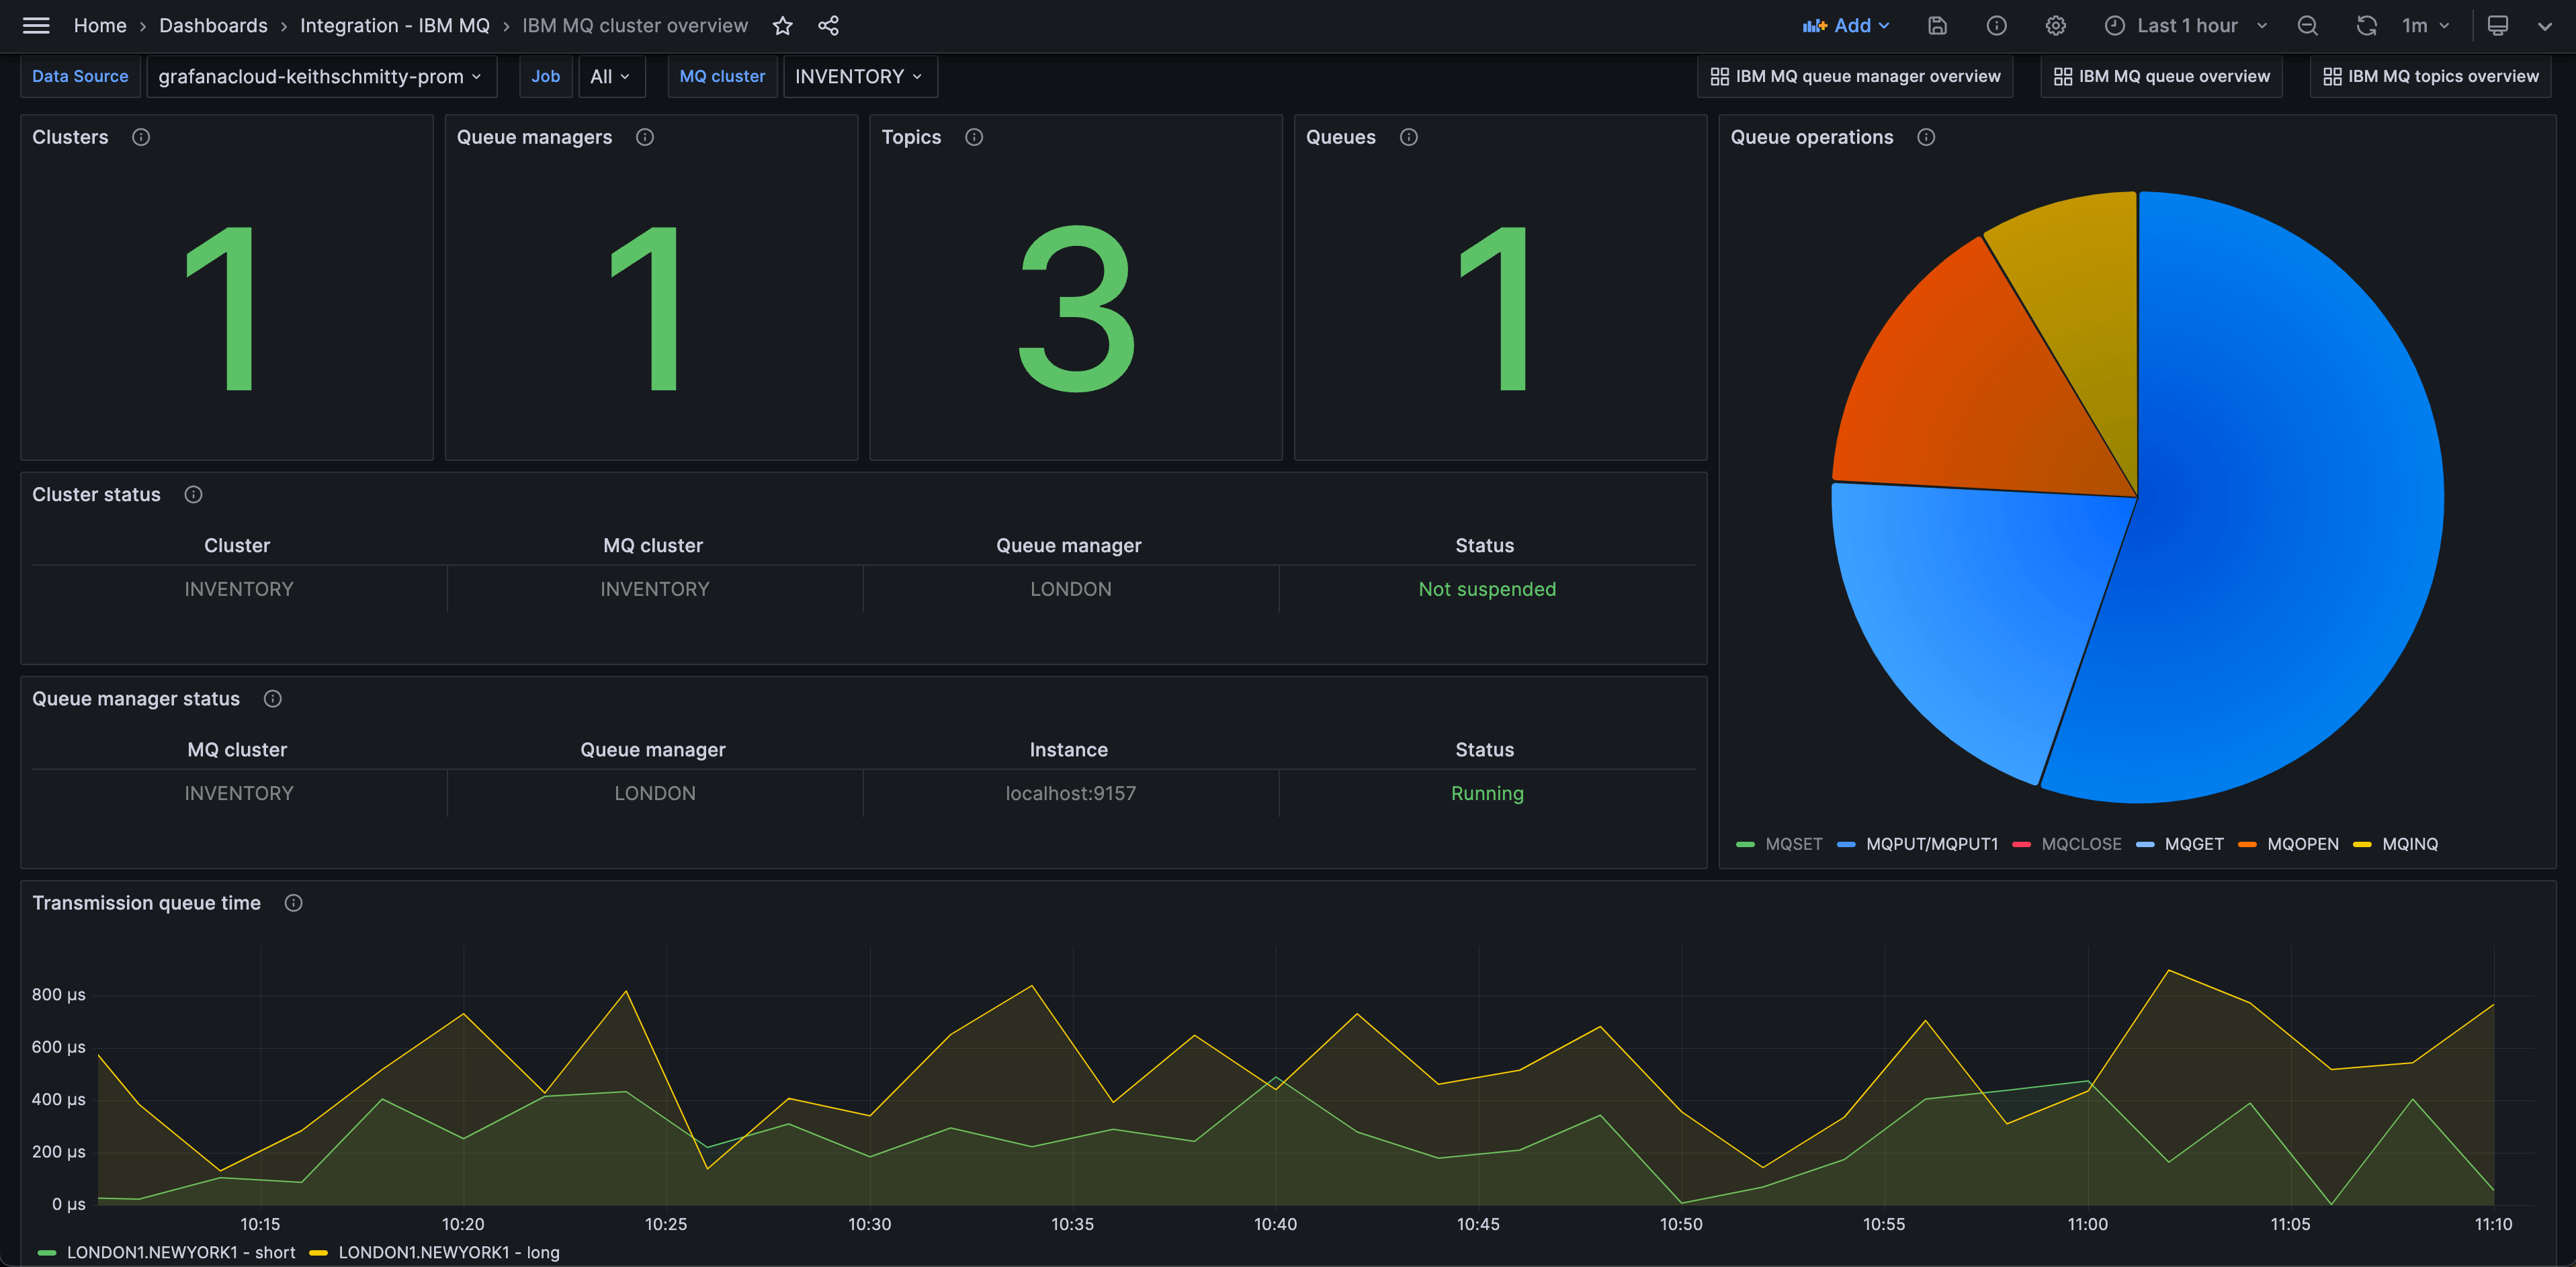
主要なアラートルールを含みます。
ibmmq_channel_xmitq_time_long
ibmmq_channel_xmitq_time_short
ibmmq_cluster_suspend
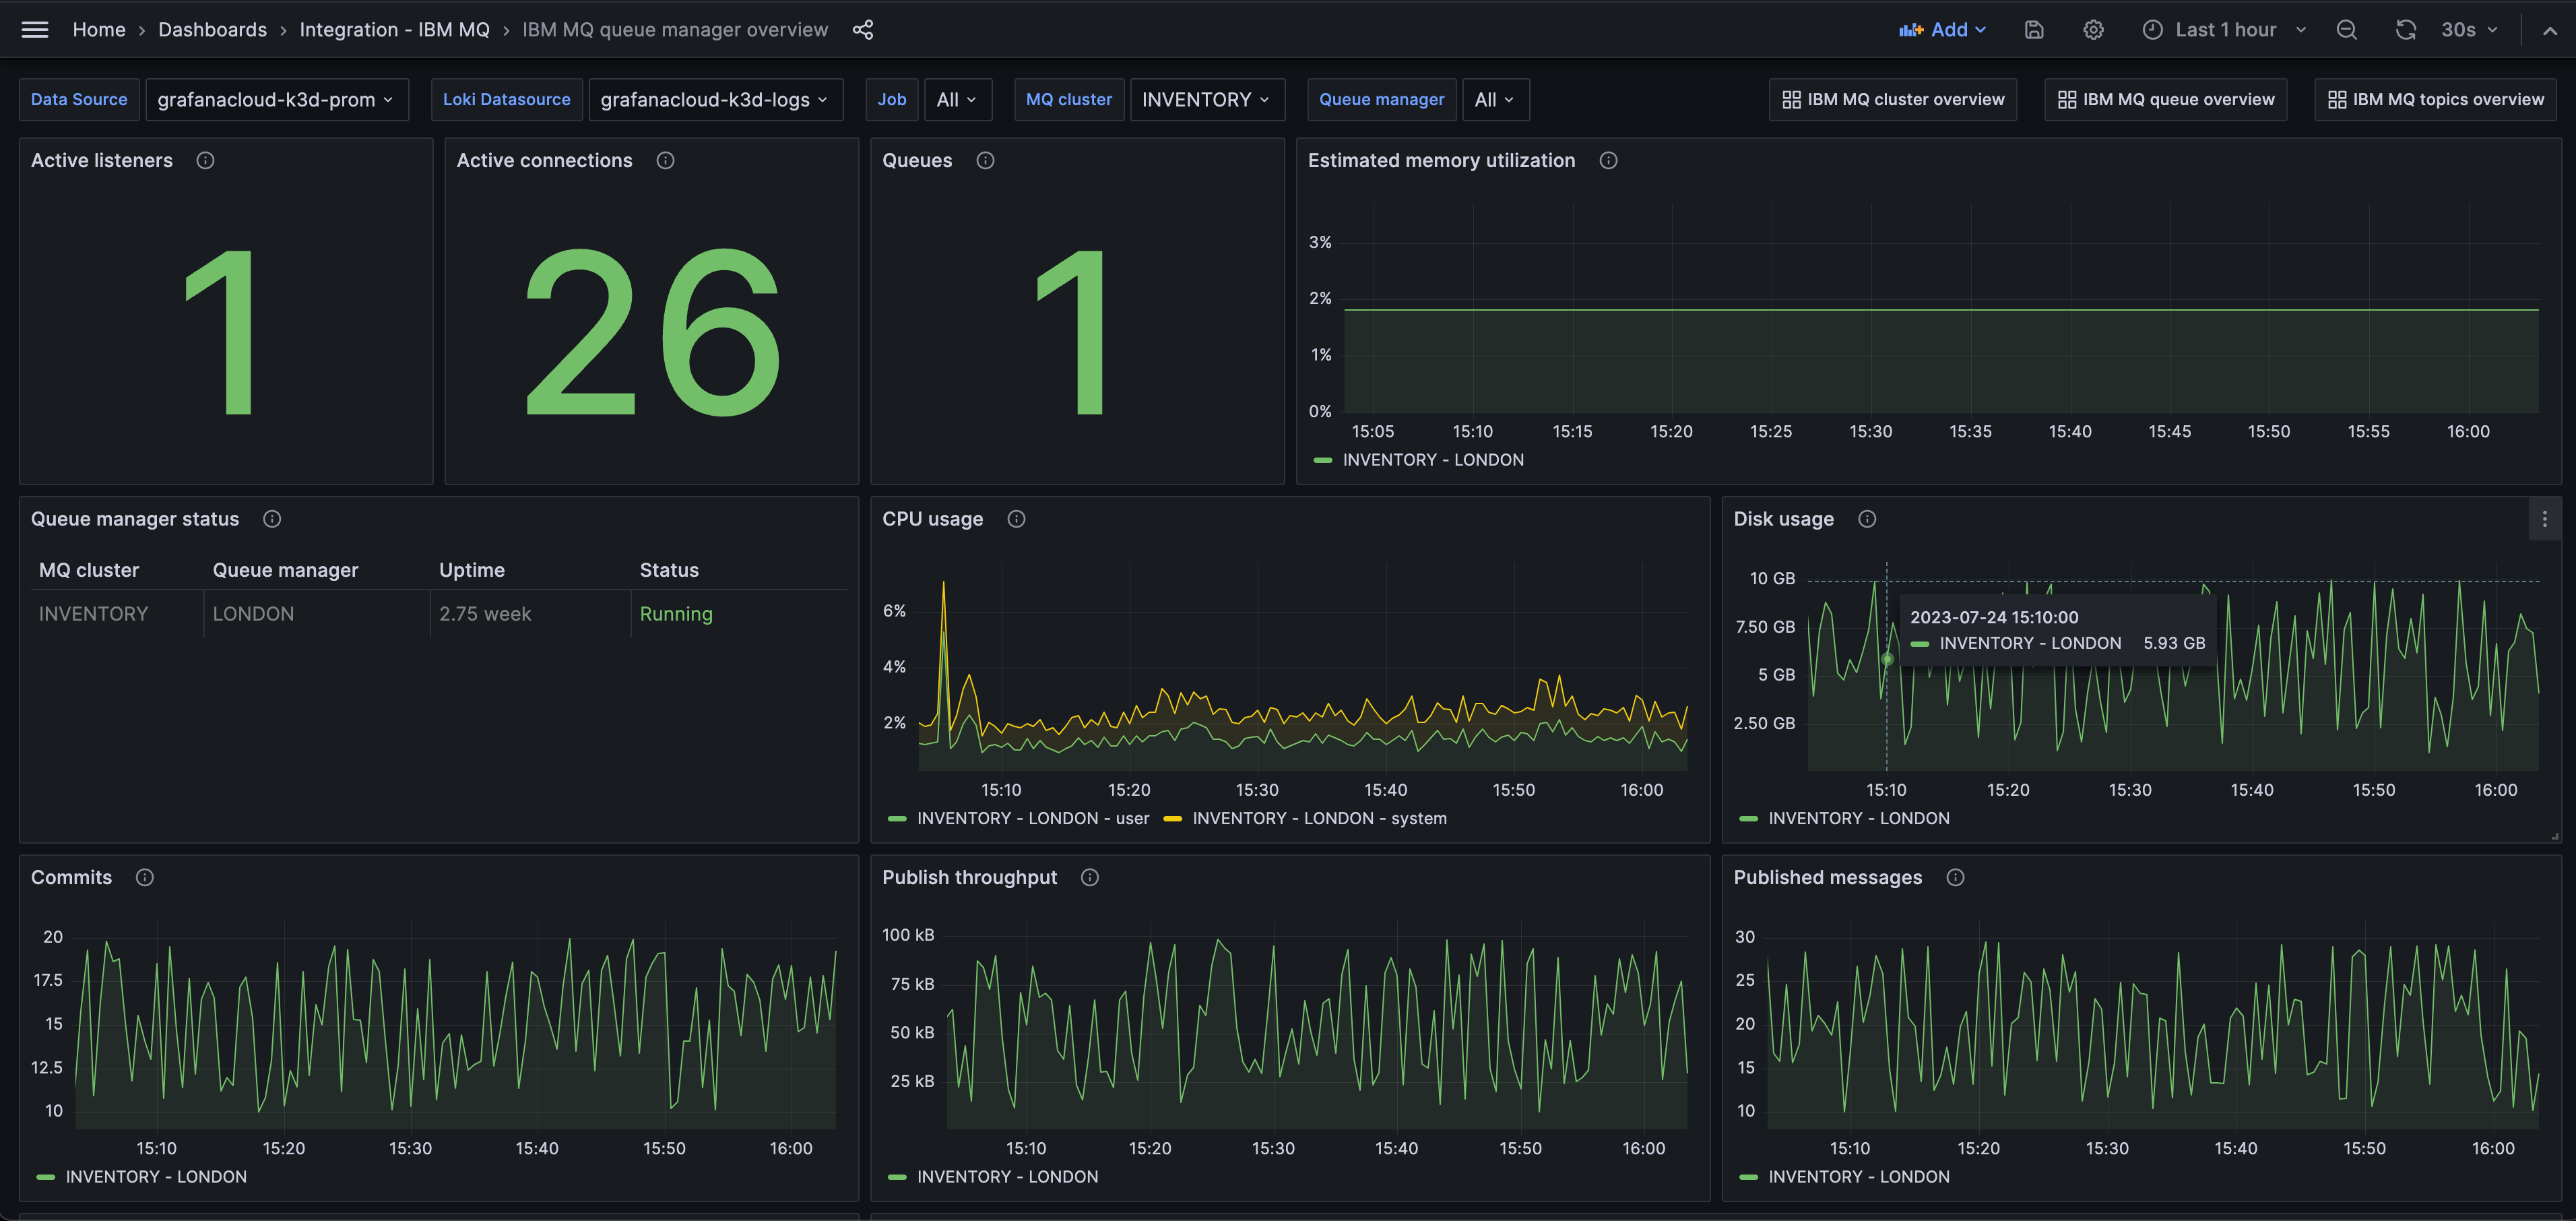
ibmmq_qmgr_active_listeners
ibmmq_qmgr_commit_count
ibmmq_qmgr_connection_count
ibmmq_qmgr_expired_message_count
ibmmq_qmgr_log_in_use_bytes
ibmmq_qmgr_log_write_latency_seconds
ibmmq_qmgr_published_to_subscribers_bytes
ibmmq_qmgr_published_to_subscribers_message_count
ibmmq_qmgr_queue_manager_file_system_free_space_percentage
ibmmq_qmgr_queue_manager_file_system_in_use_bytes
ibmmq_qmgr_ram_total_bytes
ibmmq_qmgr_ram_total_estimate_for_queue_manager_bytes
ibmmq_qmgr_status
ibmmq_qmgr_system_cpu_time_percentage
ibmmq_qmgr_uptime
ibmmq_qmgr_user_cpu_time_estimate_for_queue_manager_percentage
ibmmq_qmgr_user_cpu_time_percentage
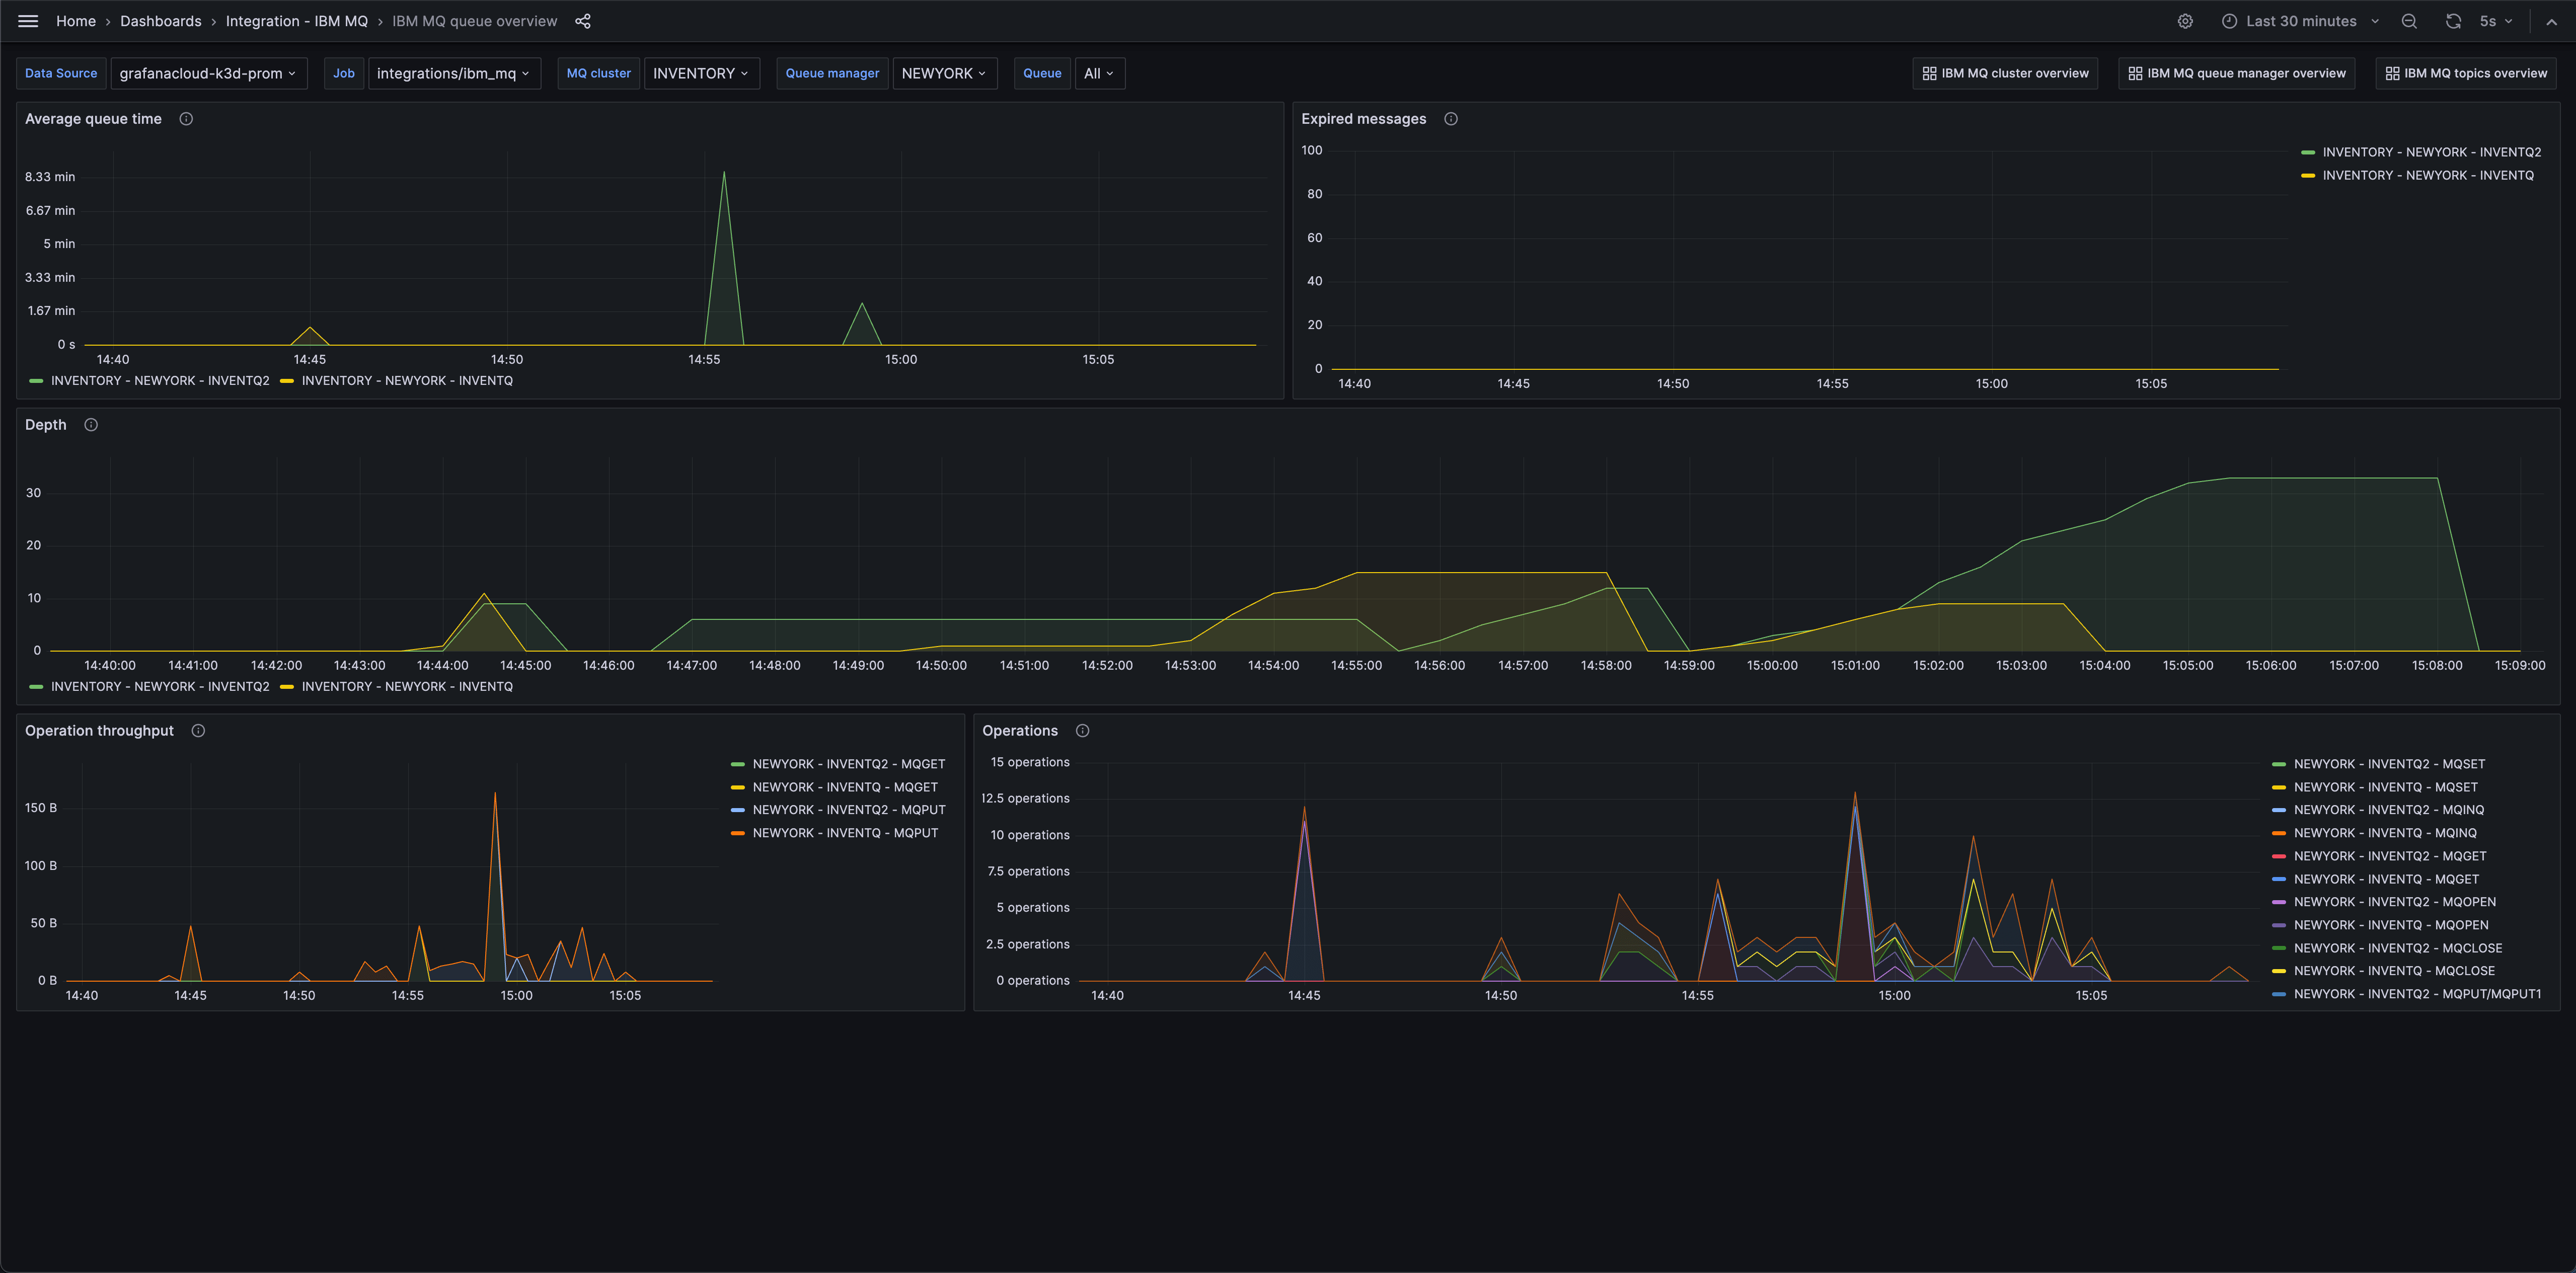
ibmmq_queue_average_queue_time_seconds
ibmmq_queue_depth
ibmmq_queue_expired_messages
ibmmq_queue_mqclose_count
ibmmq_queue_mqget_bytes
ibmmq_queue_mqget_count
ibmmq_queue_mqinq_count
ibmmq_queue_mqopen_count
ibmmq_queue_mqput_bytes
ibmmq_queue_mqput_mqput1_count
ibmmq_queue_mqset_count
ibmmq_queue_oldest_message_age
ibmmq_subscription_messsages_received
ibmmq_subscription_time_since_message_published
ibmmq_topic_messages_received
ibmmq_topic_publisher_count
ibmmq_topic_subscriber_count
ibmmq_topic_time_since_msg_received
含まれる主要なアラートルールです。
IBMMQExpiredMessages
IBMMQStaleMessages
IBMMQLowDiskSpace
IBMMQHighQueueManagerCpuUsage