
GrafanaでInfluxDBを簡単に監視
Grafana Cloudのすぐに使える監視ソリューションを使用して、オープンソースの時系列データベースであるInfluxDBのデプロイメントを簡単に監視できます。Grafana Cloudの永年無料枠には、監視ニーズをサポートするために3ユーザーと最大10,000メトリクスシリーズが含まれています。
主要なアラートルールを含みます。
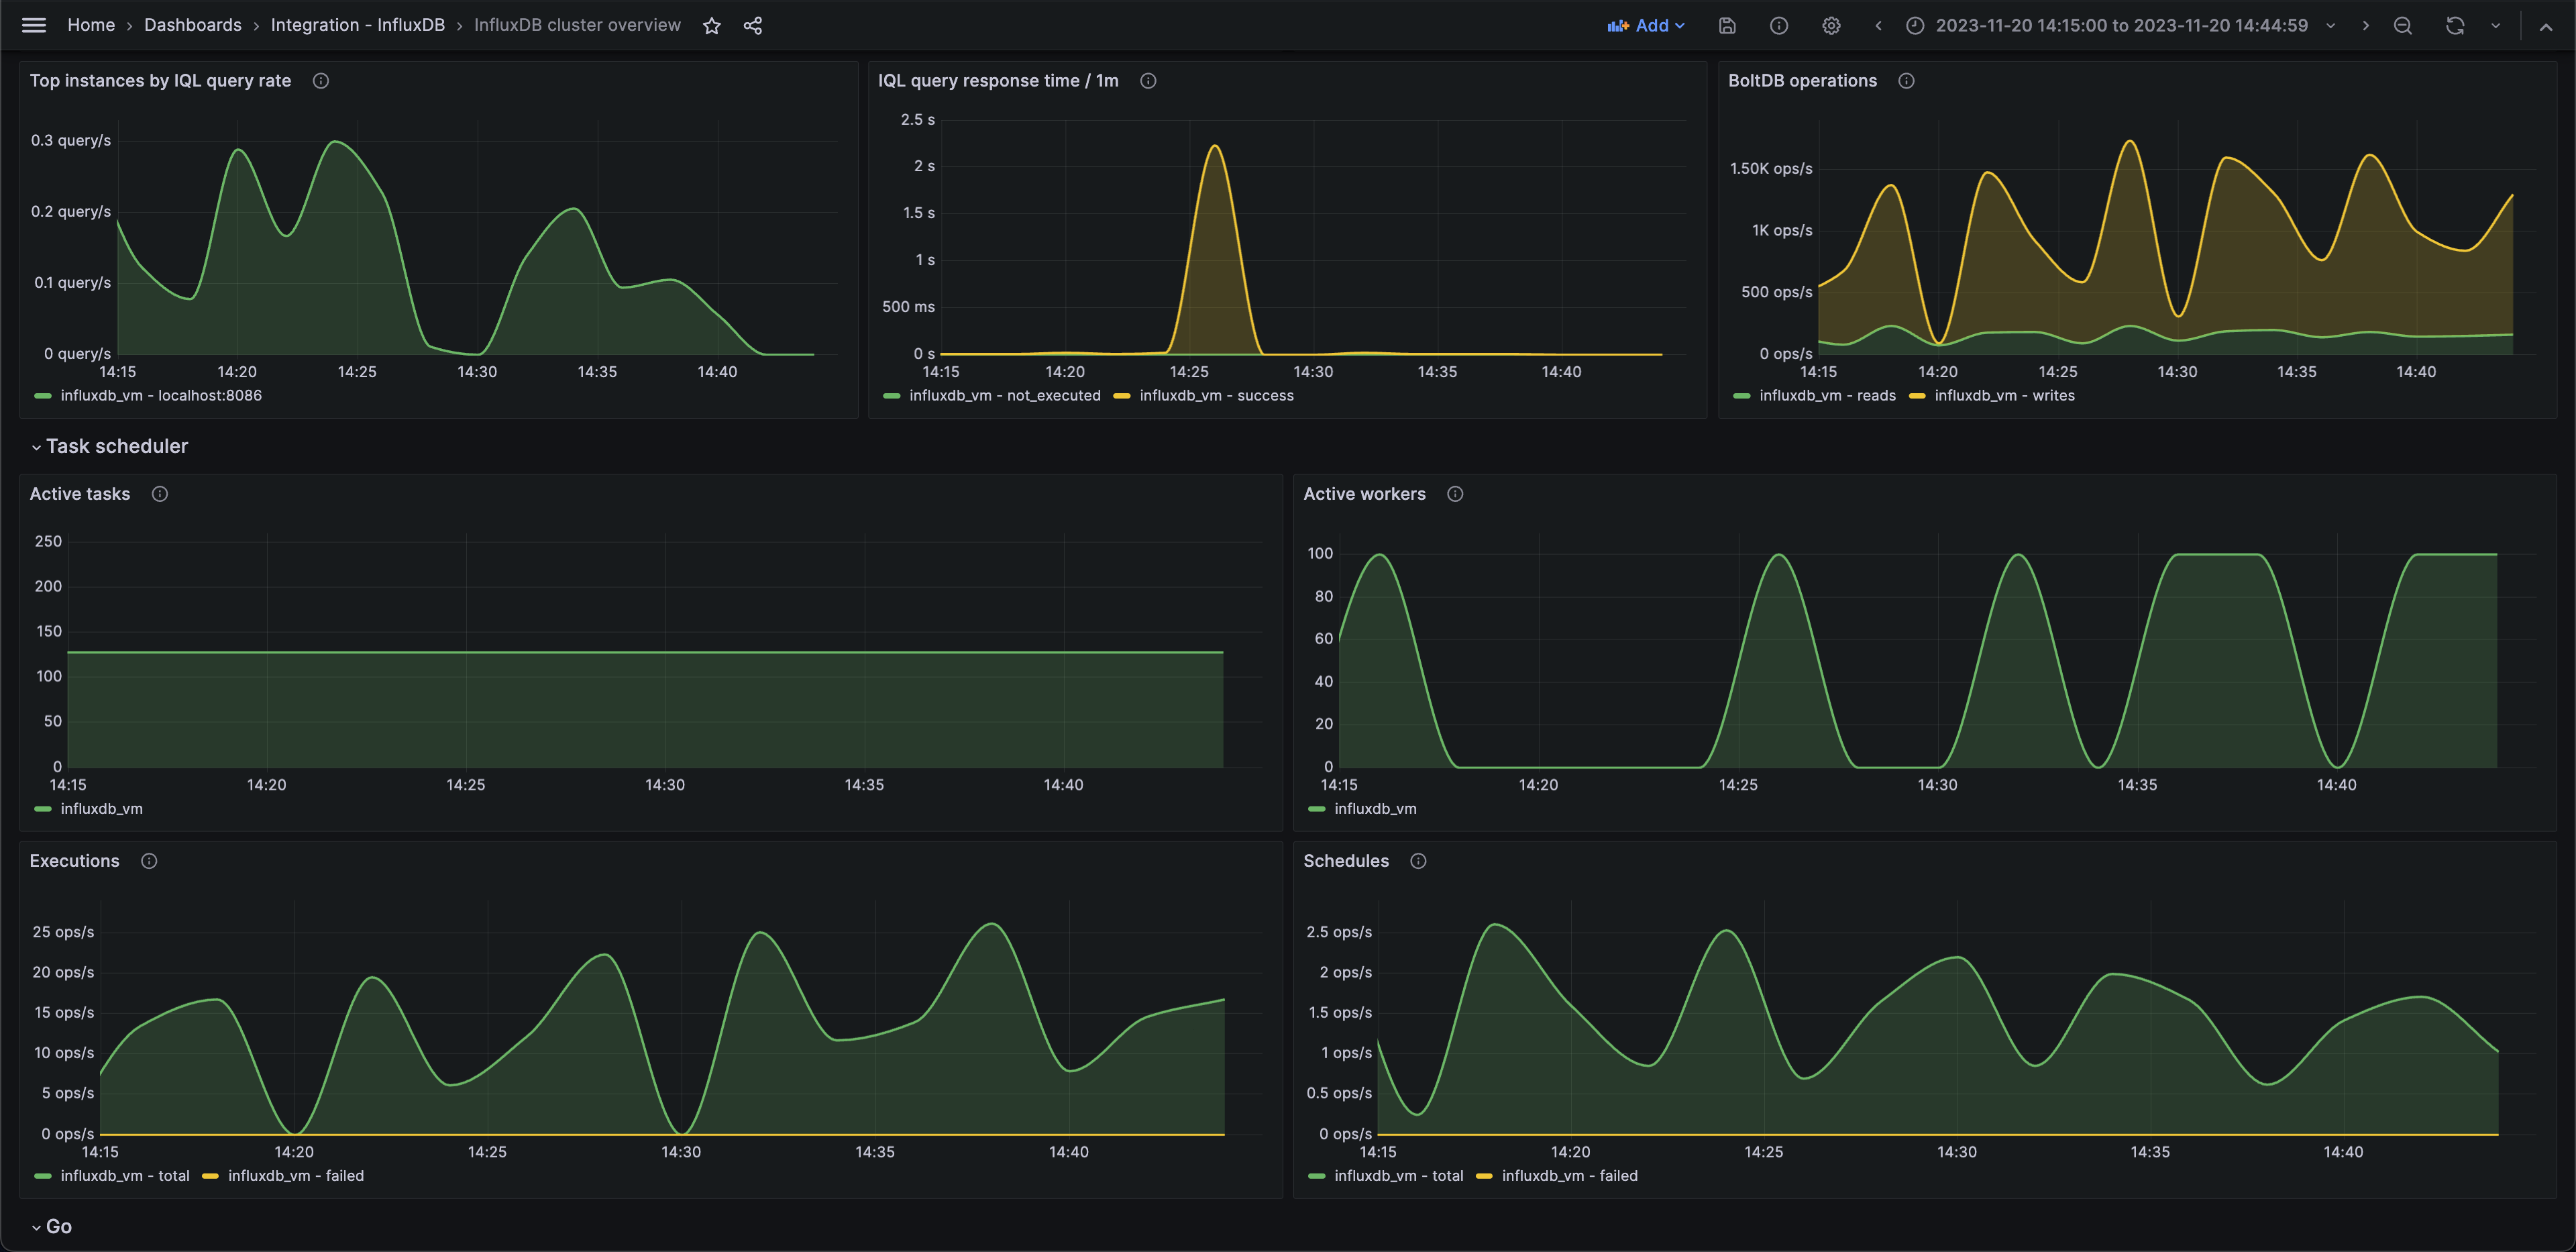
boltdb_reads_total
boltdb_writes_total
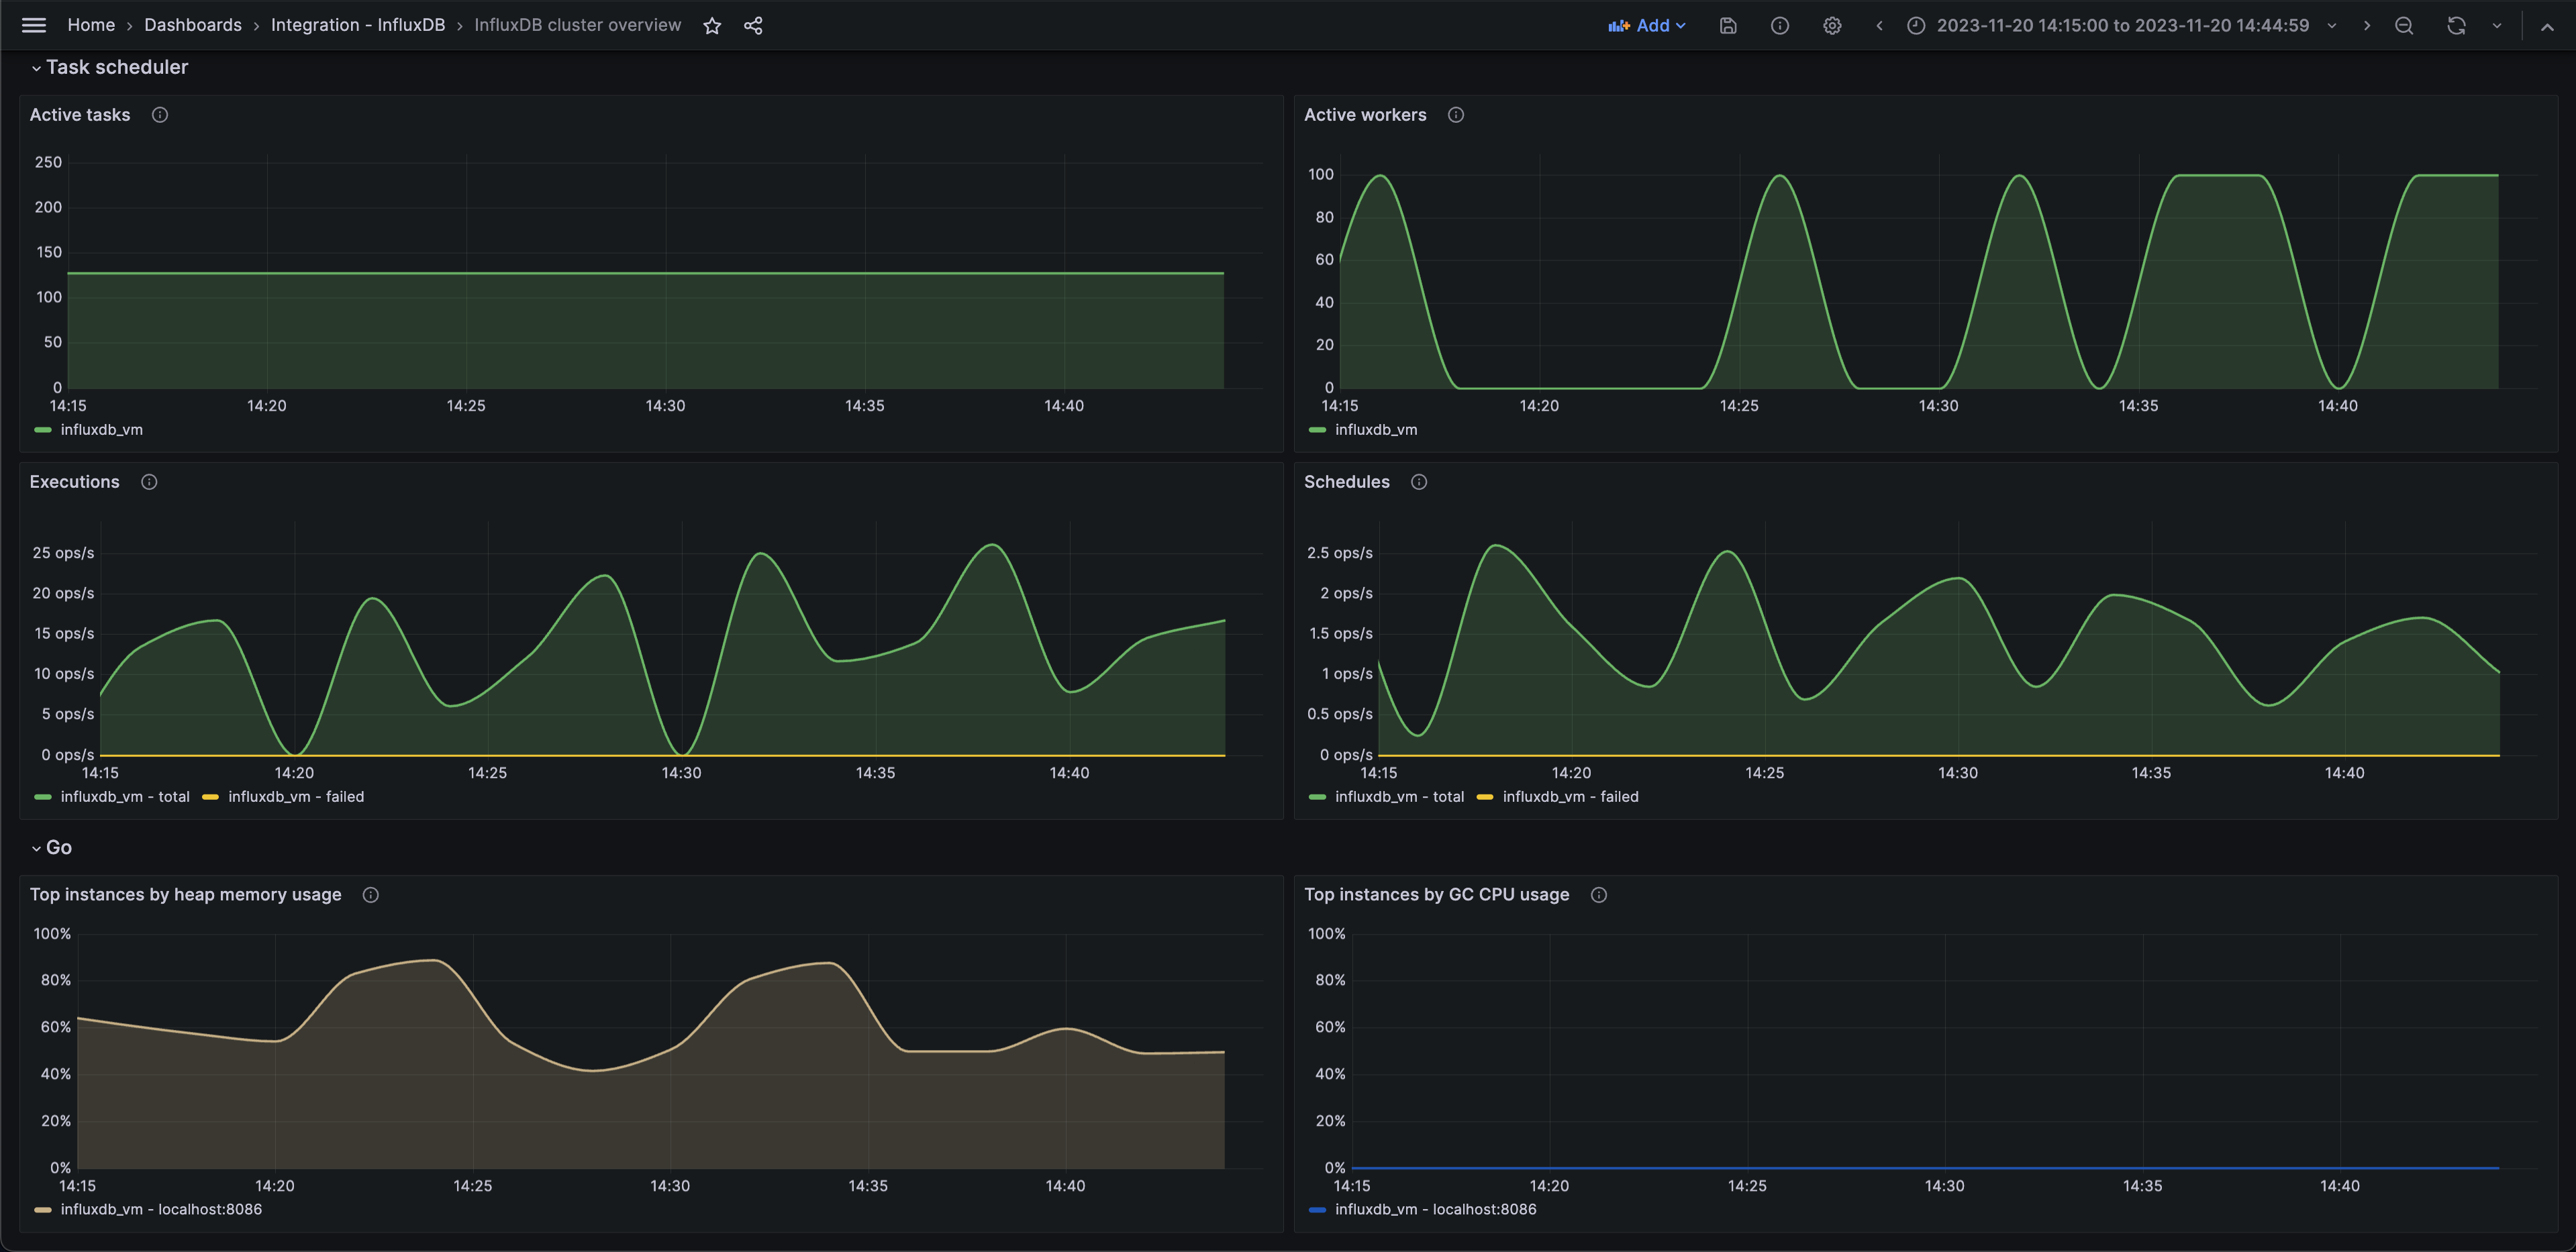
go_gc_duration_seconds_sum
go_memstats_gc_cpu_fraction
go_memstats_heap_alloc_bytes
go_memstats_heap_idle_bytes
go_memstats_last_gc_time_seconds
go_threads
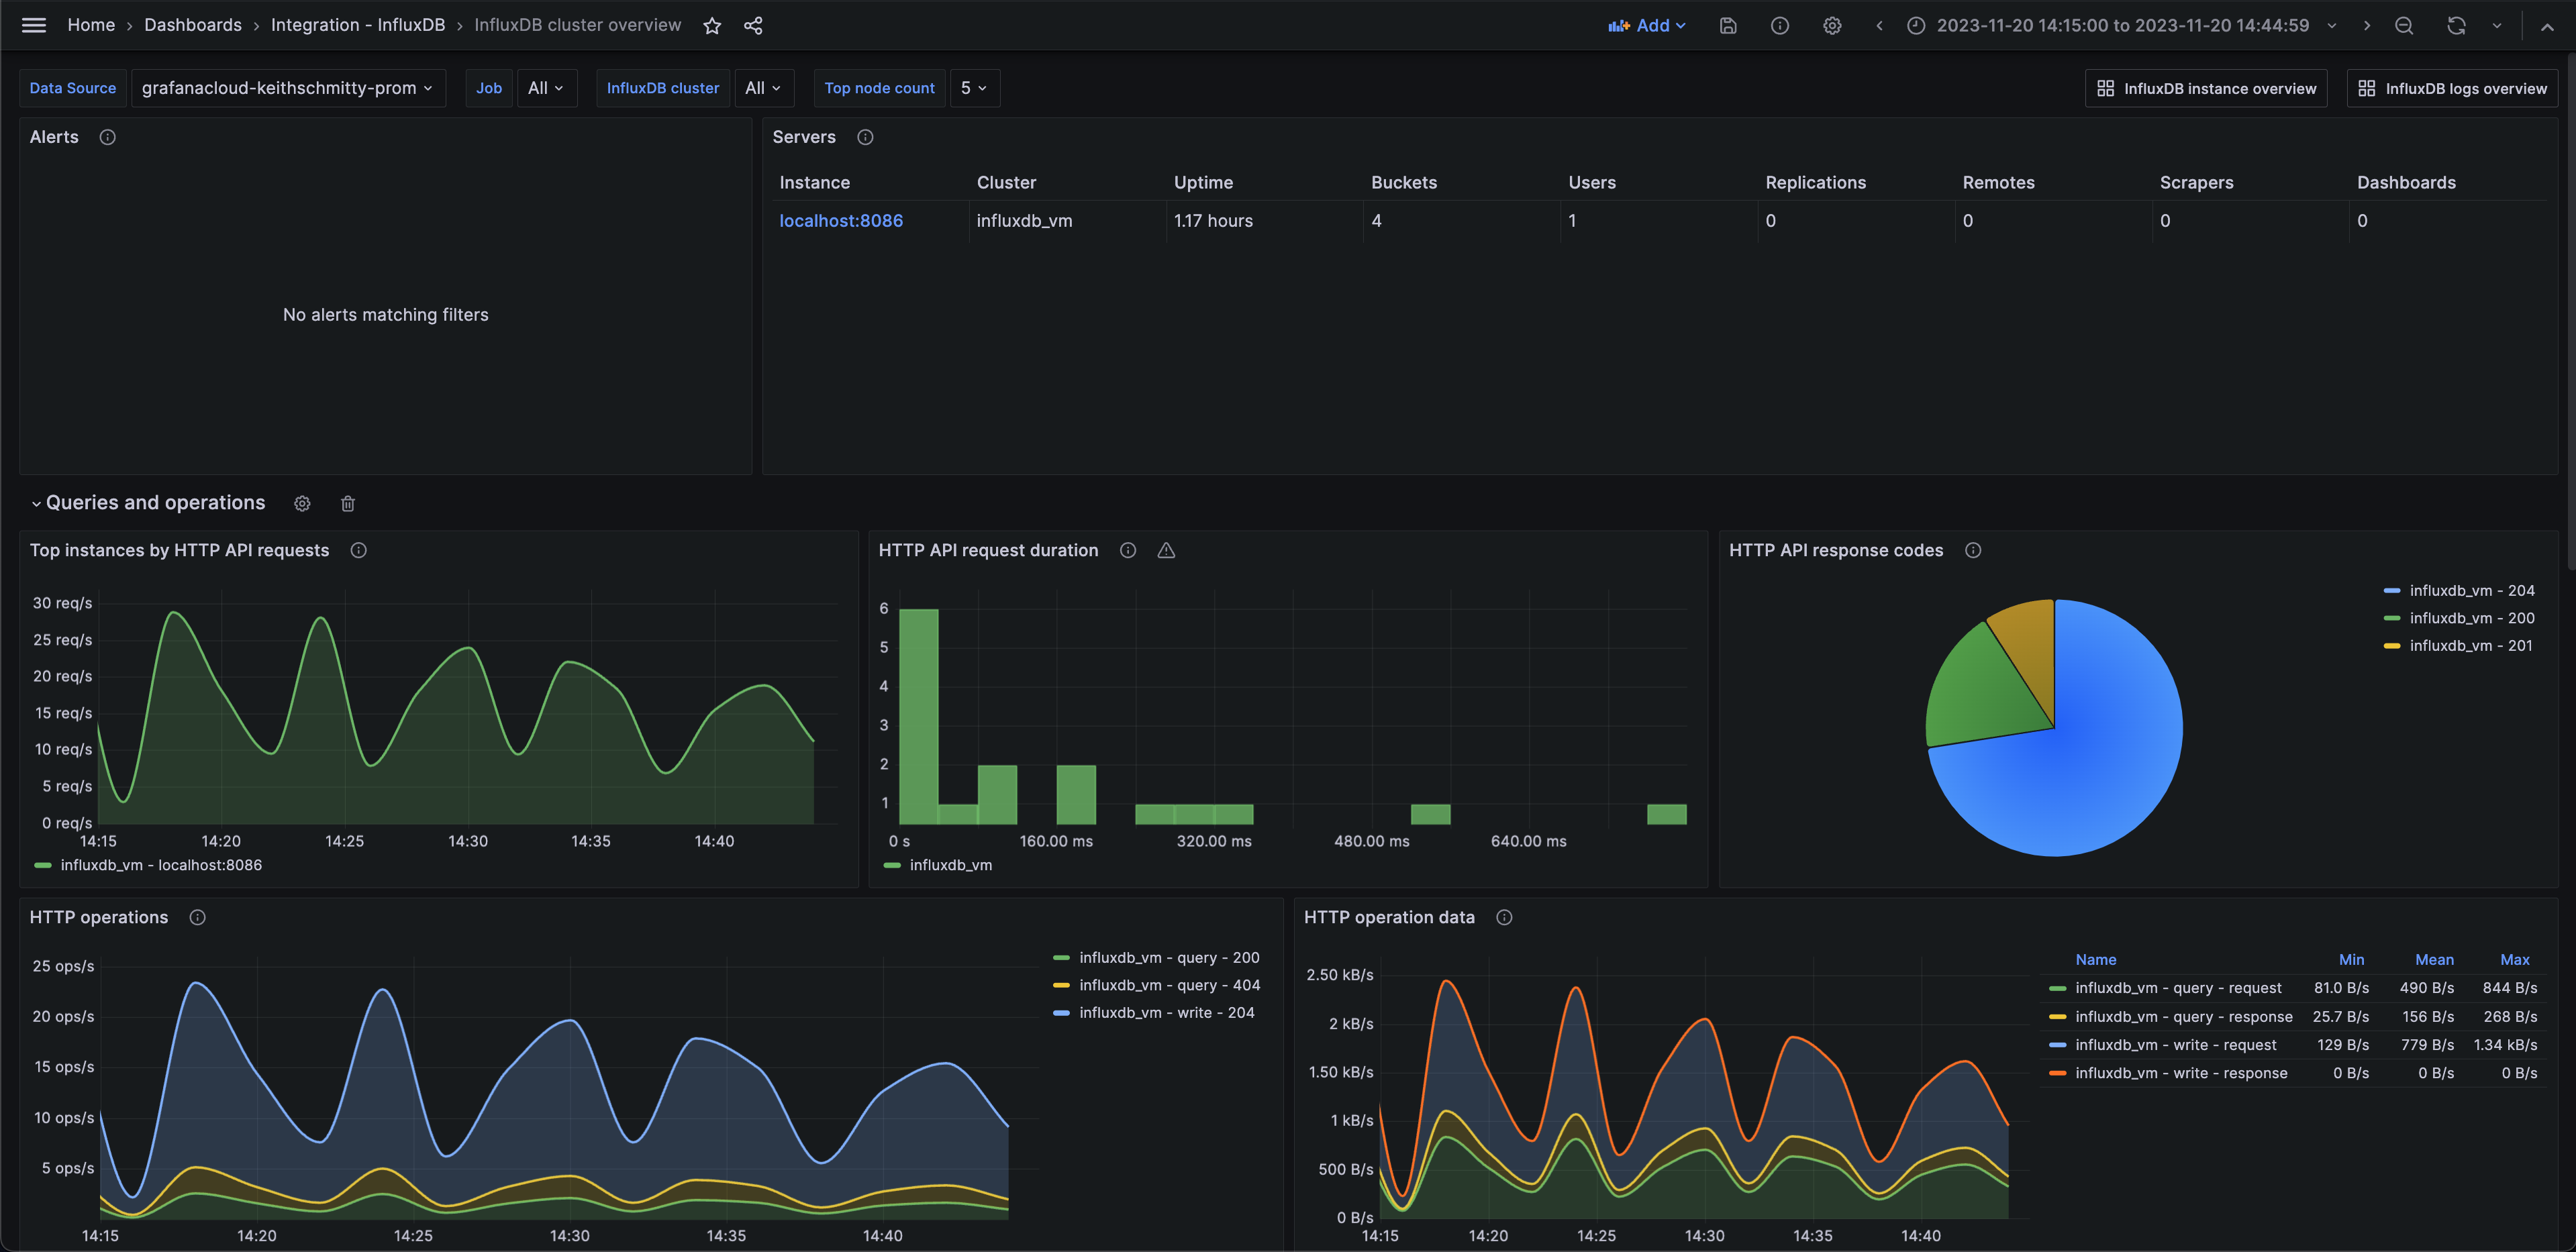
http_api_request_duration_seconds_sum
http_api_requests_total
http_query_request_bytes
http_query_request_count
http_query_response_bytes
http_write_request_bytes
http_write_request_count
http_write_response_bytes
influxdb_buckets_total
influxdb_dashboards_total
influxdb_remotes_total
influxdb_replications_total
influxdb_scrapers_total
influxdb_uptime_seconds
influxdb_users_total
influxql_service_executing_duration_seconds_sum
influxql_service_requests_total
qc_compiling_active
qc_executing_active
qc_queueing_active
task_executor_total_runs_active
task_executor_workers_busy
task_scheduler_current_execution
task_scheduler_total_execute_failure
task_scheduler_total_execution_calls
task_scheduler_total_schedule_calls
task_scheduler_total_schedule_fails
up
含まれる主要なアラートルールです。
InfluxDBWarningTaskSchedulerHighFailureRate
InfluxDBCriticalTaskSchedulerHighFailureRate
InfluxDBHighBusyWorkerPercentage
InfluxDBHighHeapMemoryUsage
InfluxDBHighAverageAPIRequestLatency
InfluxDBSlowAverageIQLExecutionTime