
What's new from Grafana Labs
Grafana Labs products, projects, and features can go through multiple release stages before becoming generally available. These stages in the release life cycle can present varying degrees of stability and support. For more information, refer to release life cycle for Grafana Labs.
Loading...
Area of interest:
Cloud availability:
Cloud editions:
Self-managed availability:
Self-managed editions:
No results found. Please adjust your filters or search criteria.
There was an error with your request.
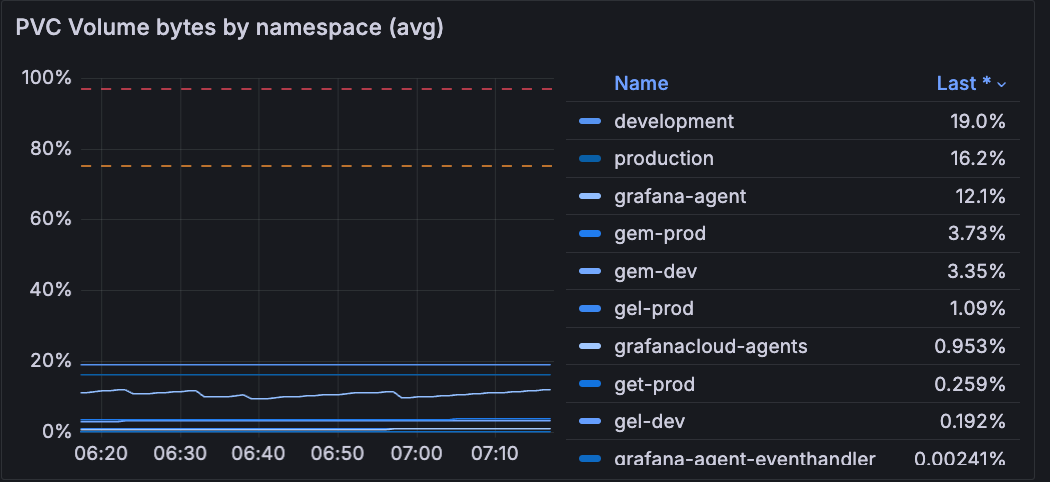
View how persistent volume (PV) changes over a specific time range in the storage tab on the Cluster, Namespace, Workload, Node, and Pod detail pages.
Grafana Service Center is now in public preview. The Service Center provides users a single pane of glass into key operational resources, including SLOs, Incidents, and Dashboards with more resources coming soon.
All Grafana SLO dashboards are now natively integrated with a Grafana SIFT panel. SIFT automatically checks burning SLOs for common issues and reports back using the SIFT panel in all auto-generated SLO dashboards. You can also manually run SIFT checks from the Grafana SLO dashboard.
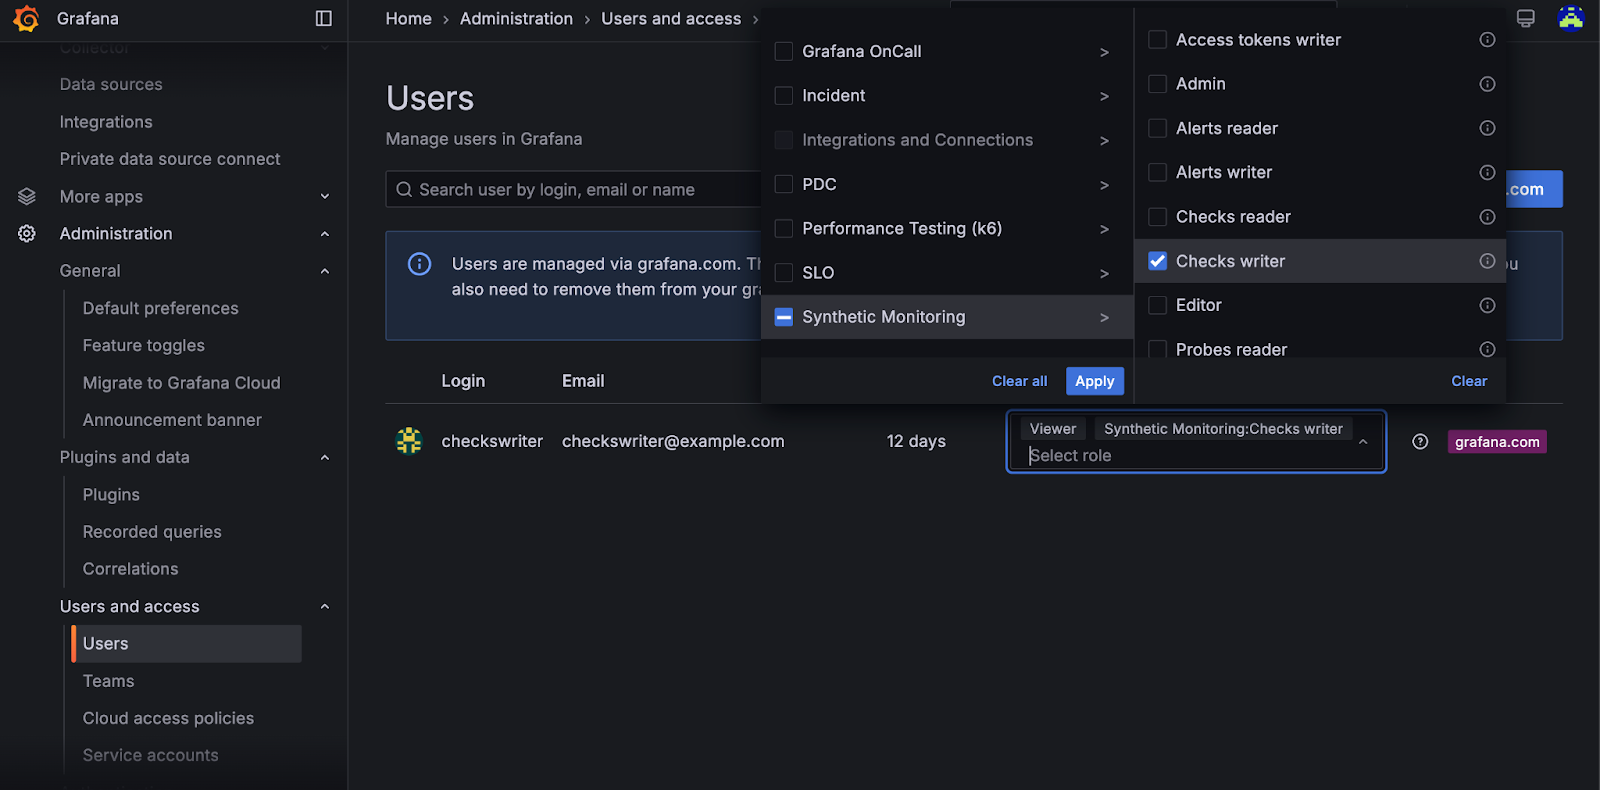
We’re excited to announce that Role-Based Access Control (RBAC) for Synthetic Monitoring is now available in private preview! This gives you the ability to fine-tune access and permissions within Synthetic Monitoring, offering greater control over who can access specific features.
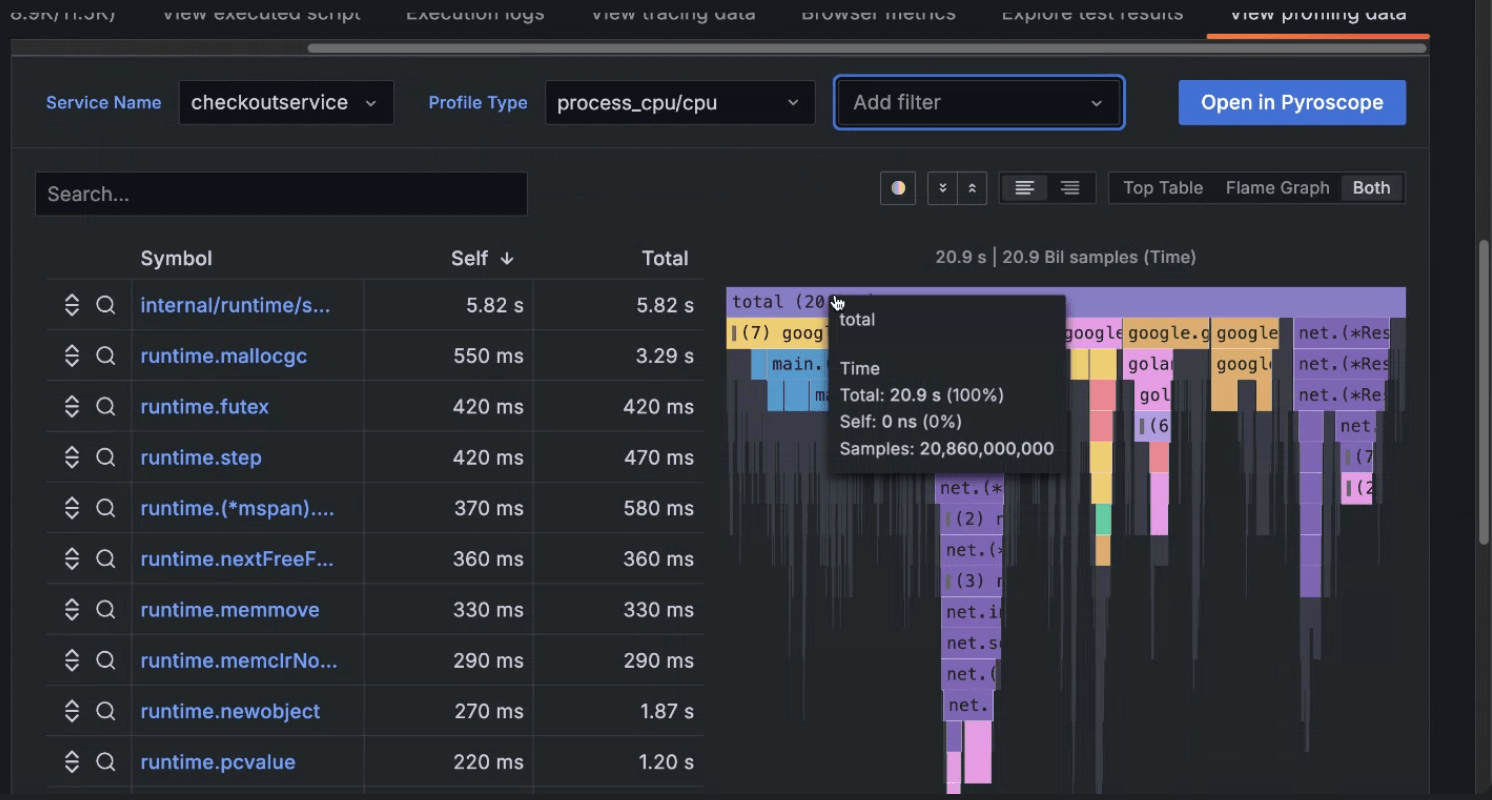
One of the basic goals of performance testing is to ensure your applications perform well under various levels of traffic. However, most performance tests are conducted with minimal insight into why a system performs a certain way during testing.
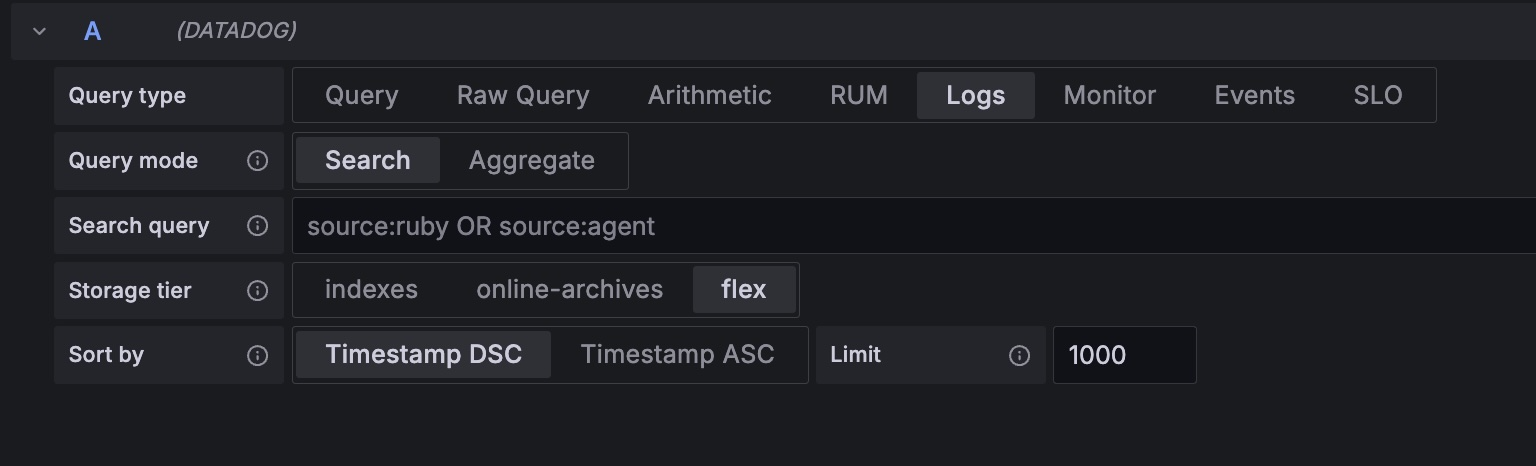
We’re excited to roll out Flex Logs, a powerful new feature for storing logs long-term while ensuring they’re available for urgent queries when needed. Ideal for critical logs like security, transaction, and network data, Flex Logs combine retention with quick access during important events.
Want to easily stop ingesting your low usage log lines? Adaptive Logs now makes this even easier, allowing you to filter recommendations by how often they are queried. Now, even fewer clicks to apply recommendations for logs which are never queried or rarely queried. This UI enhancement makes it easy to quickly get started with, and get value from, Adaptive Logs.

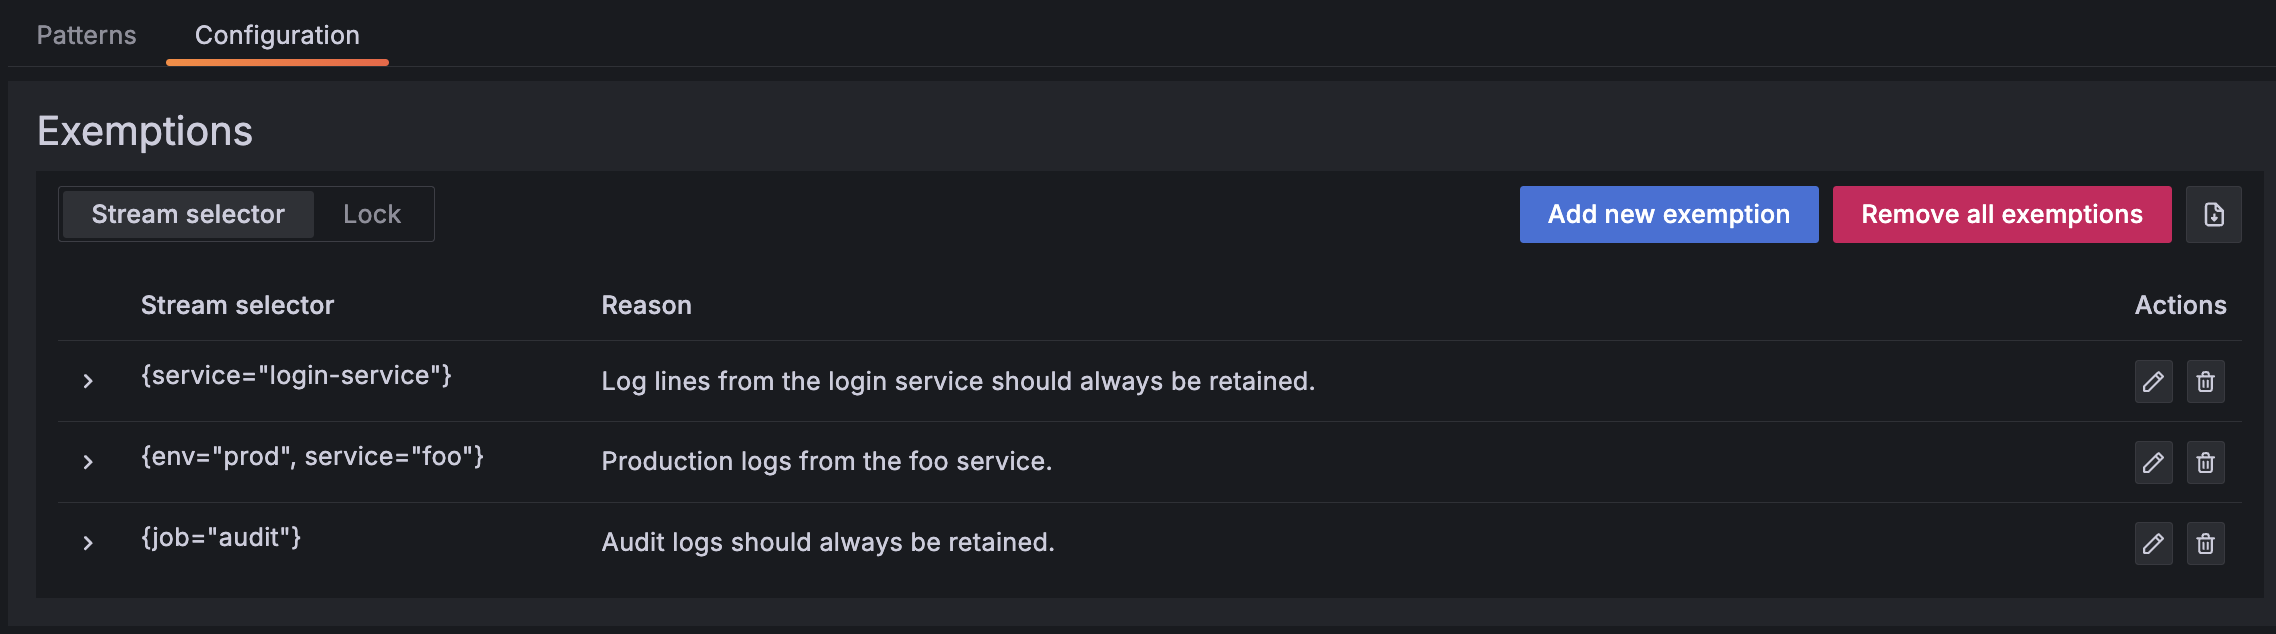
Adaptive Logs introduces support for exempting specified logs from drop recommendations to Grafana, giving you greater control of your data.
You can tell Adaptive Logs to not drop log lines from certain streams using the Stream selector. This ensures specified logs are ingested into Grafana Cloud, and not dropped by Adaptive Logs, no matter what our usage recommendations initially suggest. Our recommendation engine also updates to include the exemptions you specify.
Manage notification policies through Role-Based Access Control (RBAC). Choose who can create, edit, and read notification policies using fixed roles.
You can only grant different access levels to the entire notification policy tree; not to individual notification policies.
The feature flag alertingApiServer is now enabled by default.
In the UI, administrators have more granular control over which parts of notification settings users have access to.
The Machine Learning team is delighted to announce a new dynamic UI for Metric Forecasts!
Will the prediction algorithm see the patterns you expect in your data? If you tweak some of the parameters, will you get a better result?
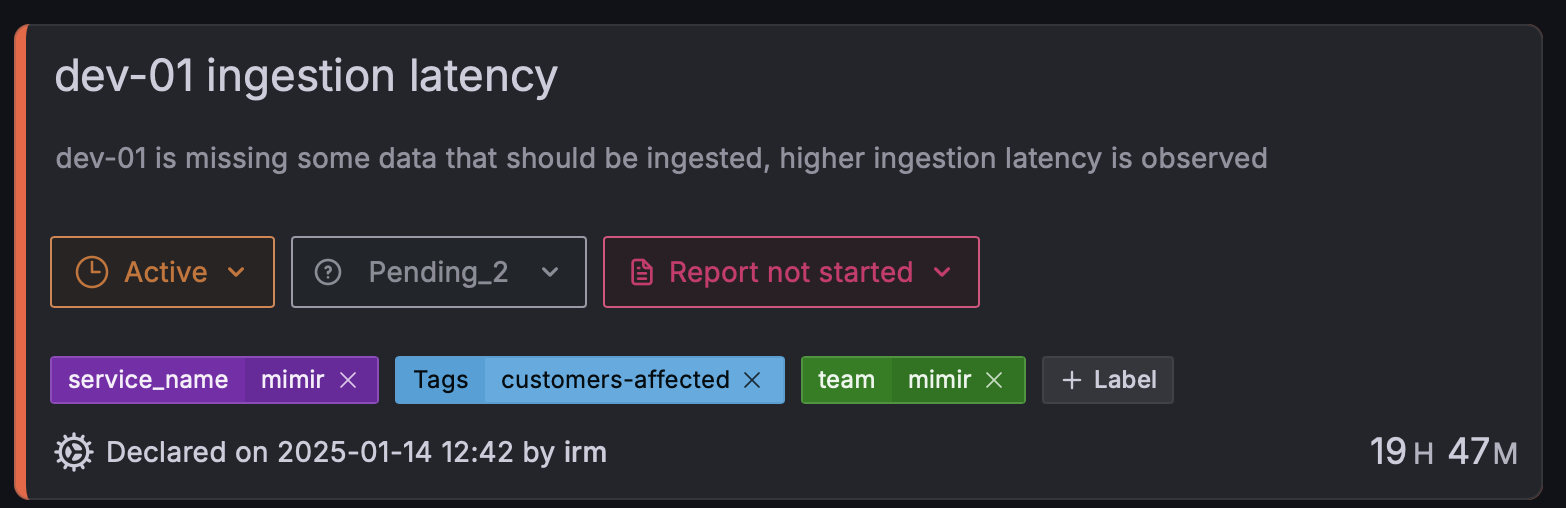
Are you tracking incidents with a few simple tags but still struggling to see the bigger picture? We’ve heard your feedback and have overhauled how you can organize and correlate incidents across your observability workflows.
Grafana Cloud Traces introduces a new safeguard to help maintain stability and prevent out-of-memory crashes when fetching traces that contain large span attributes. With this change, attributes exceeding 2KB (2048 bytes) are automatically truncated before they’re stored, striking a balance between preserving valuable trace data and maintaining overall system stability.
You can now apply Adaptive Logs recommendations per-service.
This feature is useful if multiple services are producing logs with identical patterns, and you want to treat logs from those services differently. It also makes bulk applying recommendations per service, or team, easier and more useful.
The Plugin Frontend Sandbox is a security feature that isolates plugin frontend code from the main Grafana application. When enabled, plugins run in a separate JavaScript context, which provides several security benefits: