
What's new from Grafana Labs
Grafana Labs products, projects, and features can go through multiple release stages before becoming generally available. These stages in the release life cycle can present varying degrees of stability and support. For more information, refer to release life cycle for Grafana Labs.
Loading...
Area of interest:
Cloud availability:
Cloud editions:
Self-managed availability:
Self-managed editions:
No results found. Please adjust your filters or search criteria.
There was an error with your request.
Throughout Kubernetes Monitoring, hover to reveal the copy icon. You can click to copy any text so that you can:
- Use it in your own query.
- Paste it in the command line.
- Send it to others.
The improved navigation menu gives you a better overview by showing all levels of navigation items in a more compact design. We also implemented a better dock and imprved scrolling behavior. Furthermore, we improved the structure of the nav menu and added several new items.
Table view was created to help facilitate ease of use in a point and click UI, as opposed to data source specific query language formatting options, like loki’s line_format.
Plugins can now add custom actions into Grafana’s command palette. Actions can link directly to a plugin page, or open a modal to allow users to interact with a plugin without losing their current page.
Grafana AWS observability introduces monitoring for your EC2 instances, all within an embedded experience, and without the need for managing or configuring local agents or building dashboards.
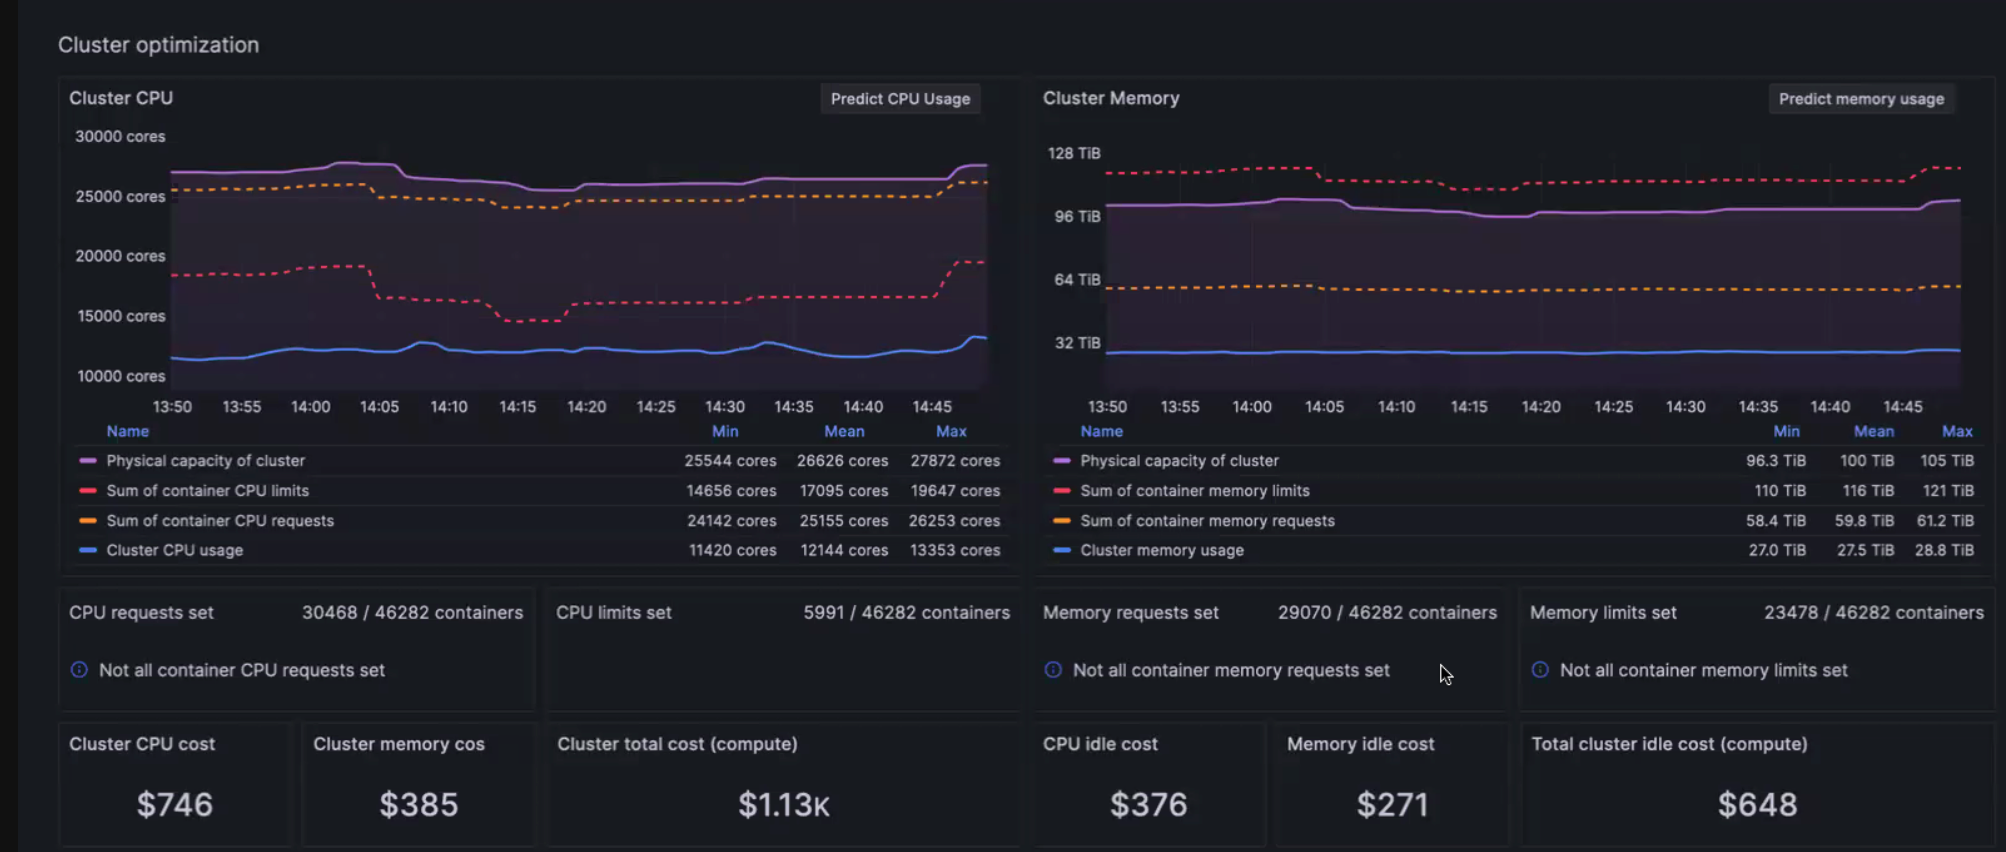
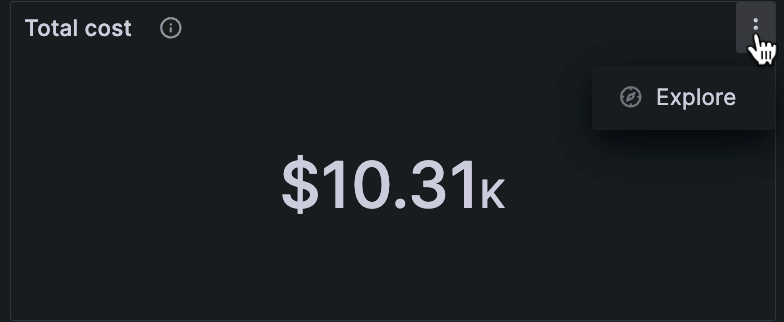
Cost monitoring and investigation and troubleshooting of CPU and memory usage are now easier for both Clusters and Nodes. Go to the optimization panels for the Cluster and Node detail pages to view the CPU and memory utilization, as well as cost information.
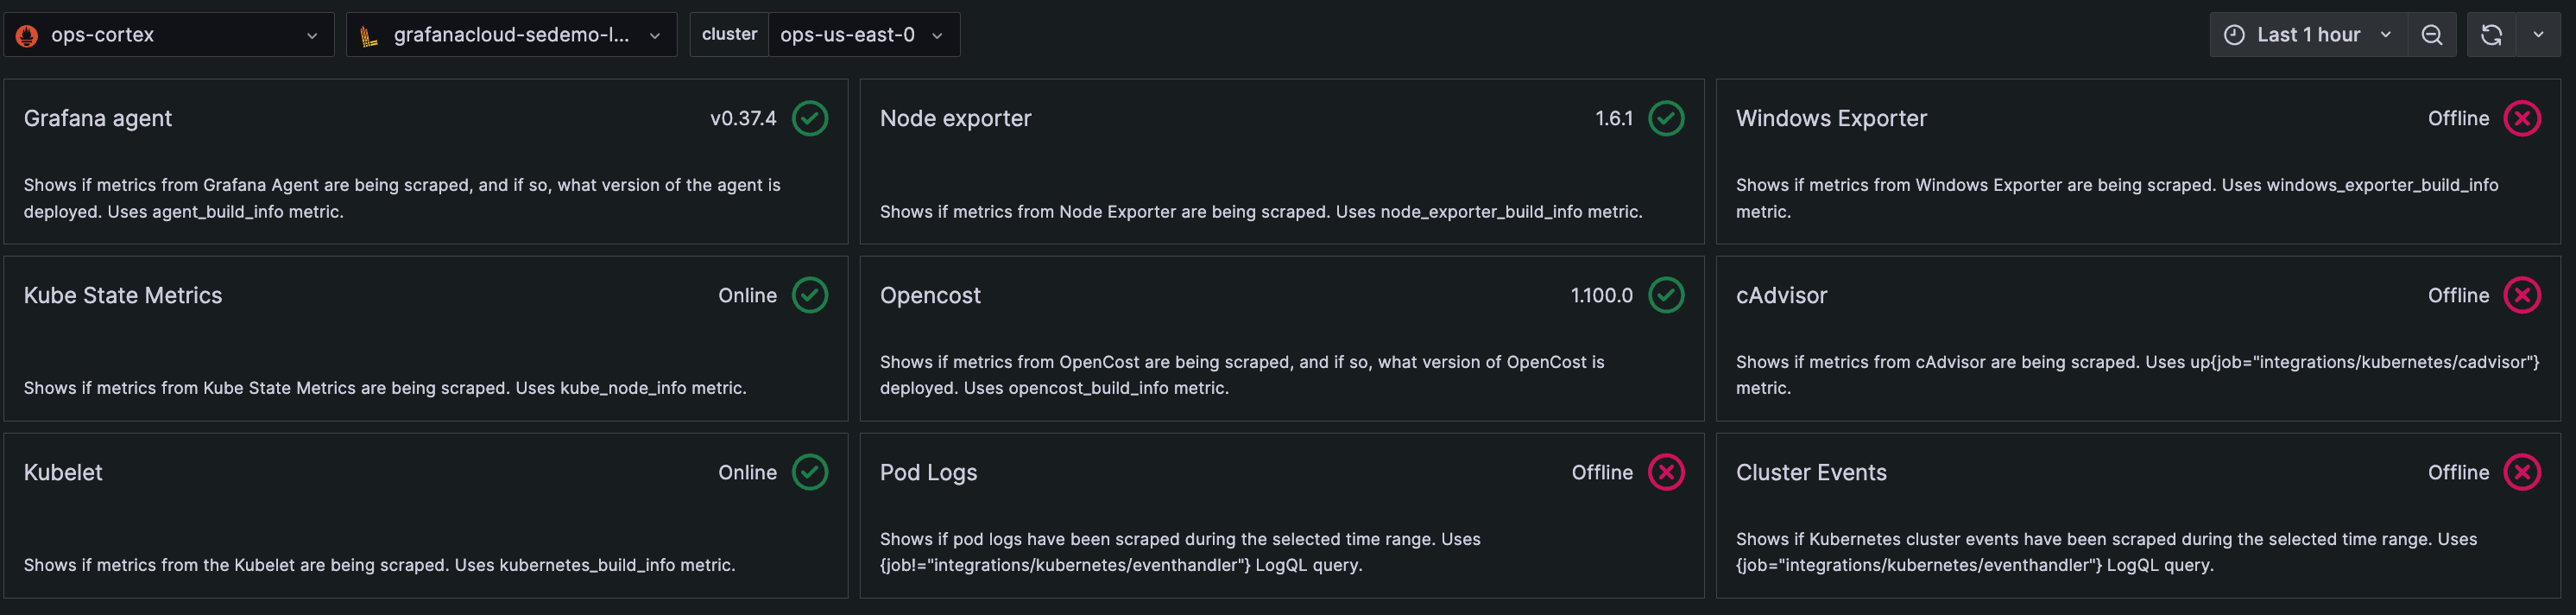
The Metrics status tab, which shows the configuration status of Kubernetes Monitoring components, is updated for better usability and quicker comprehension.
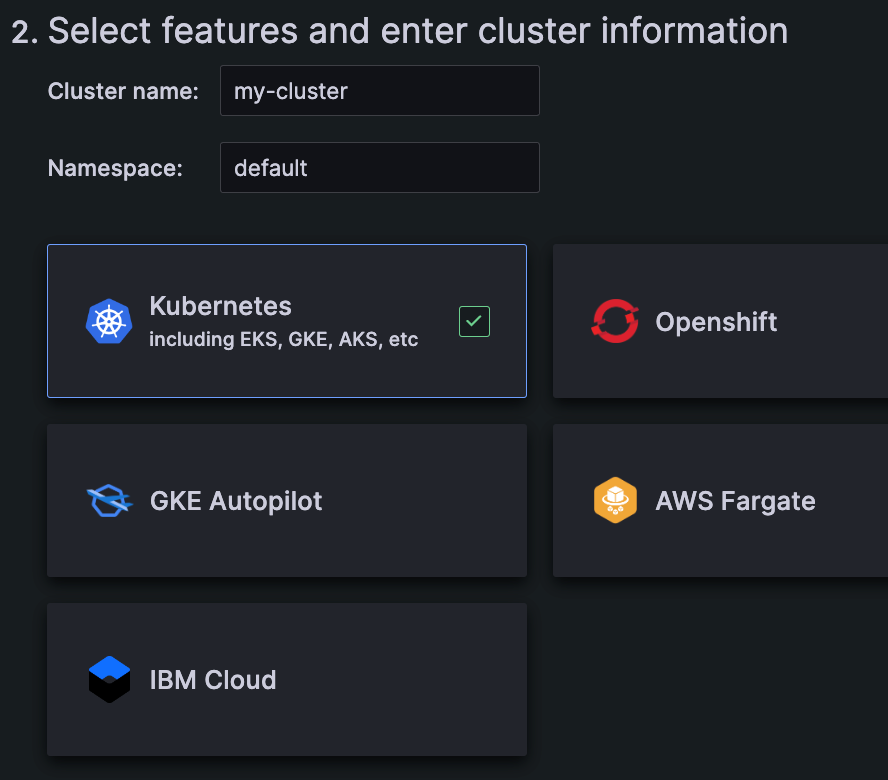
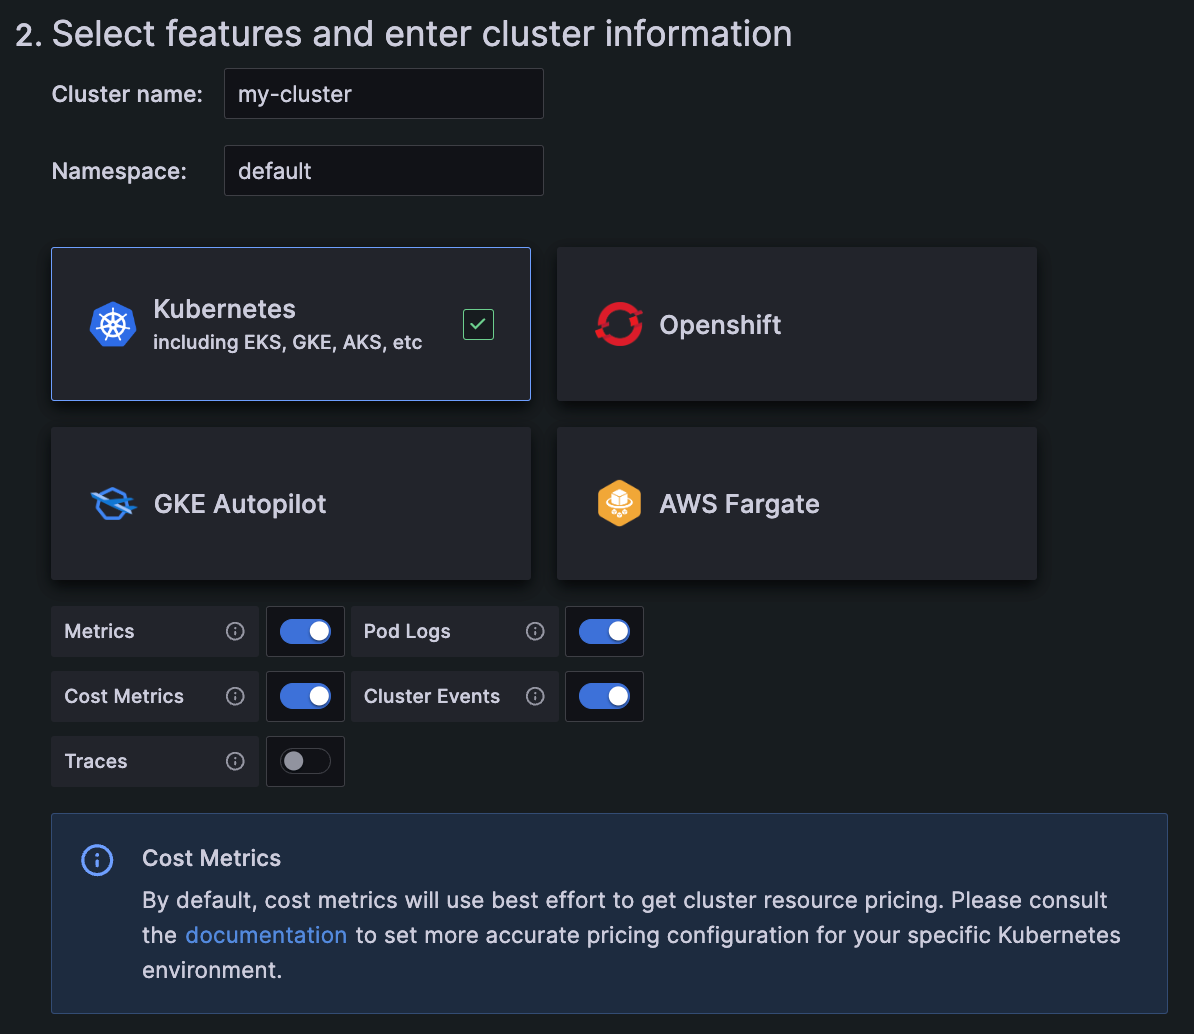
When configuring Kubernetes Monitoring with the streamlined configuration wizard that uses Grafana Kubernetes Helm Chart, you can select the platform you are using.
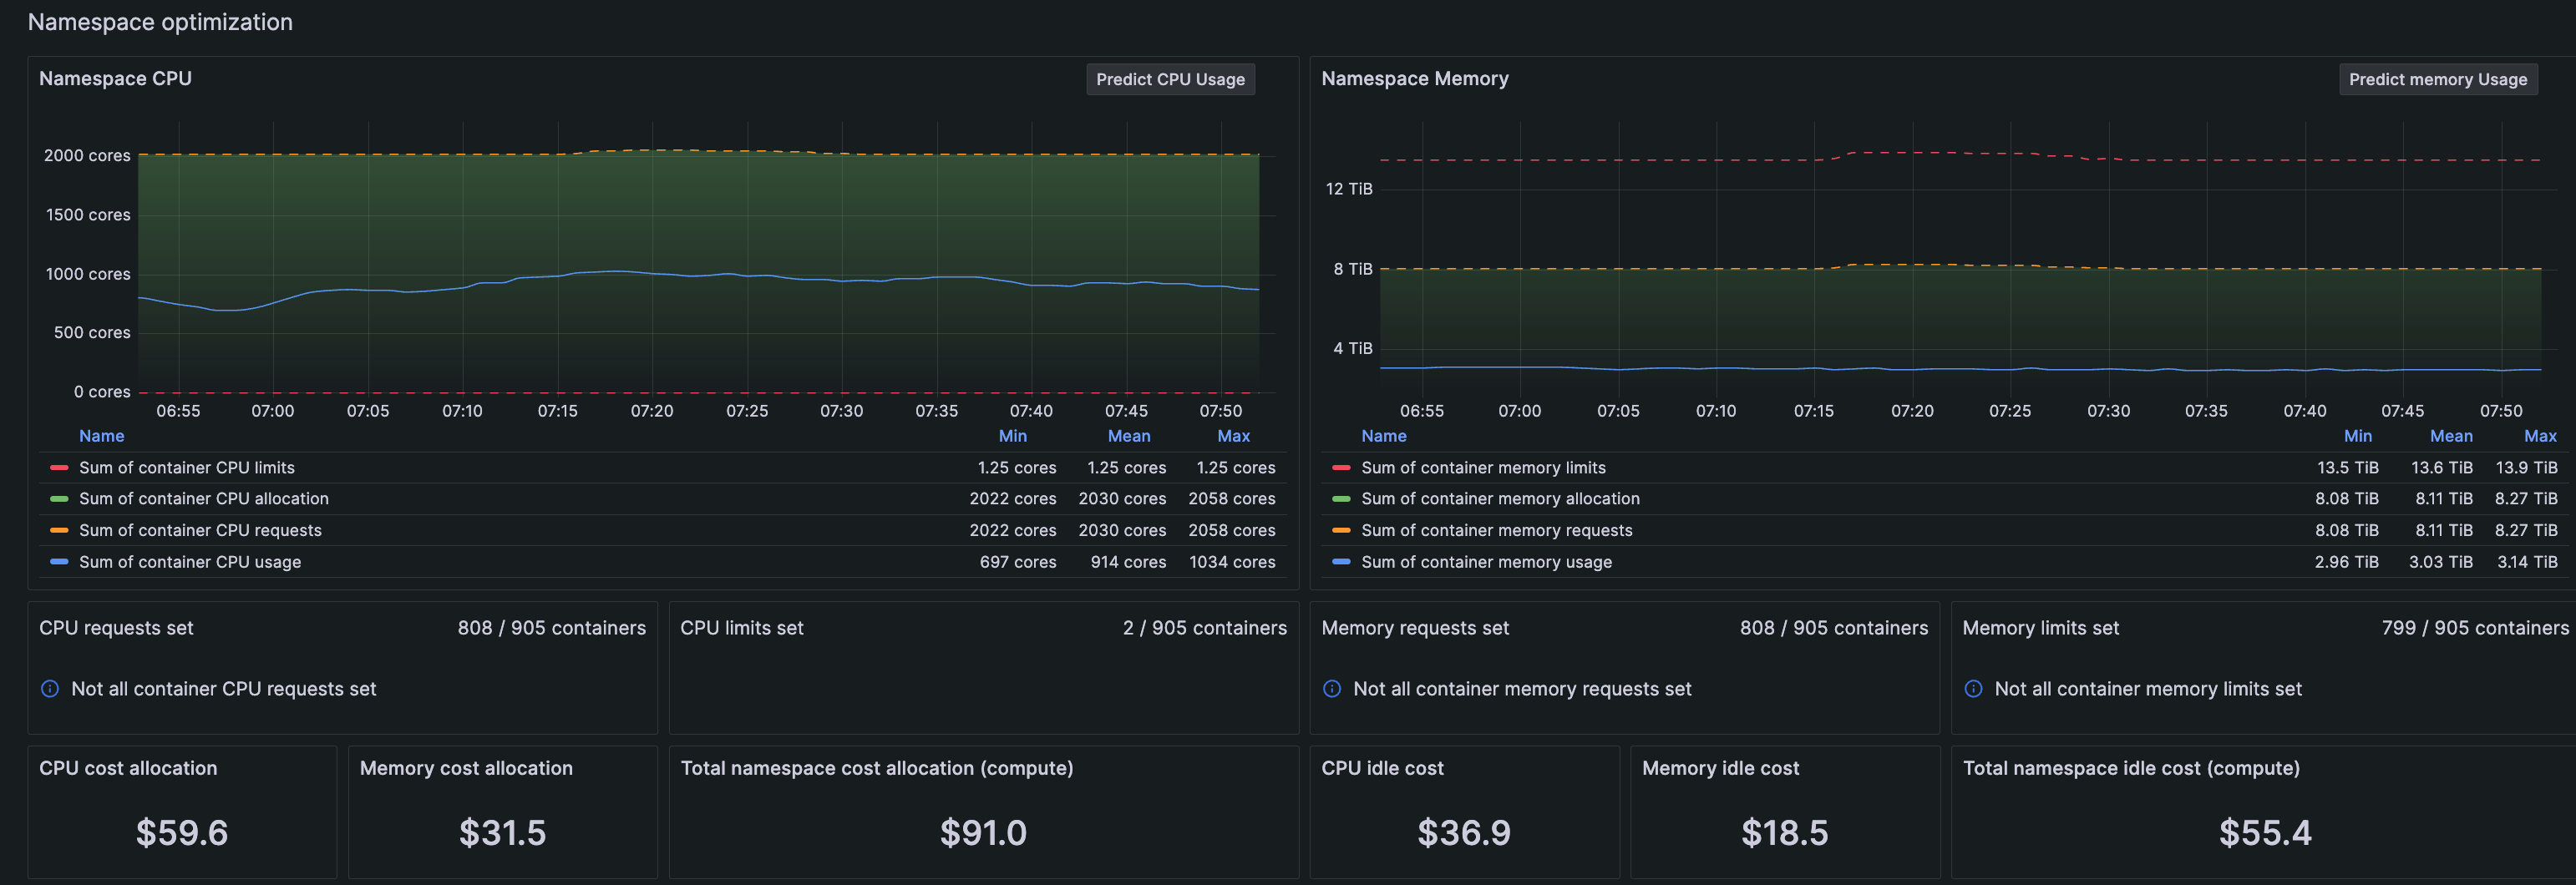
CPU and memory usage graphs and details, along with associated costs, are available on these pages in Kubernetes Monitoring:
- Namespace details page
![]()
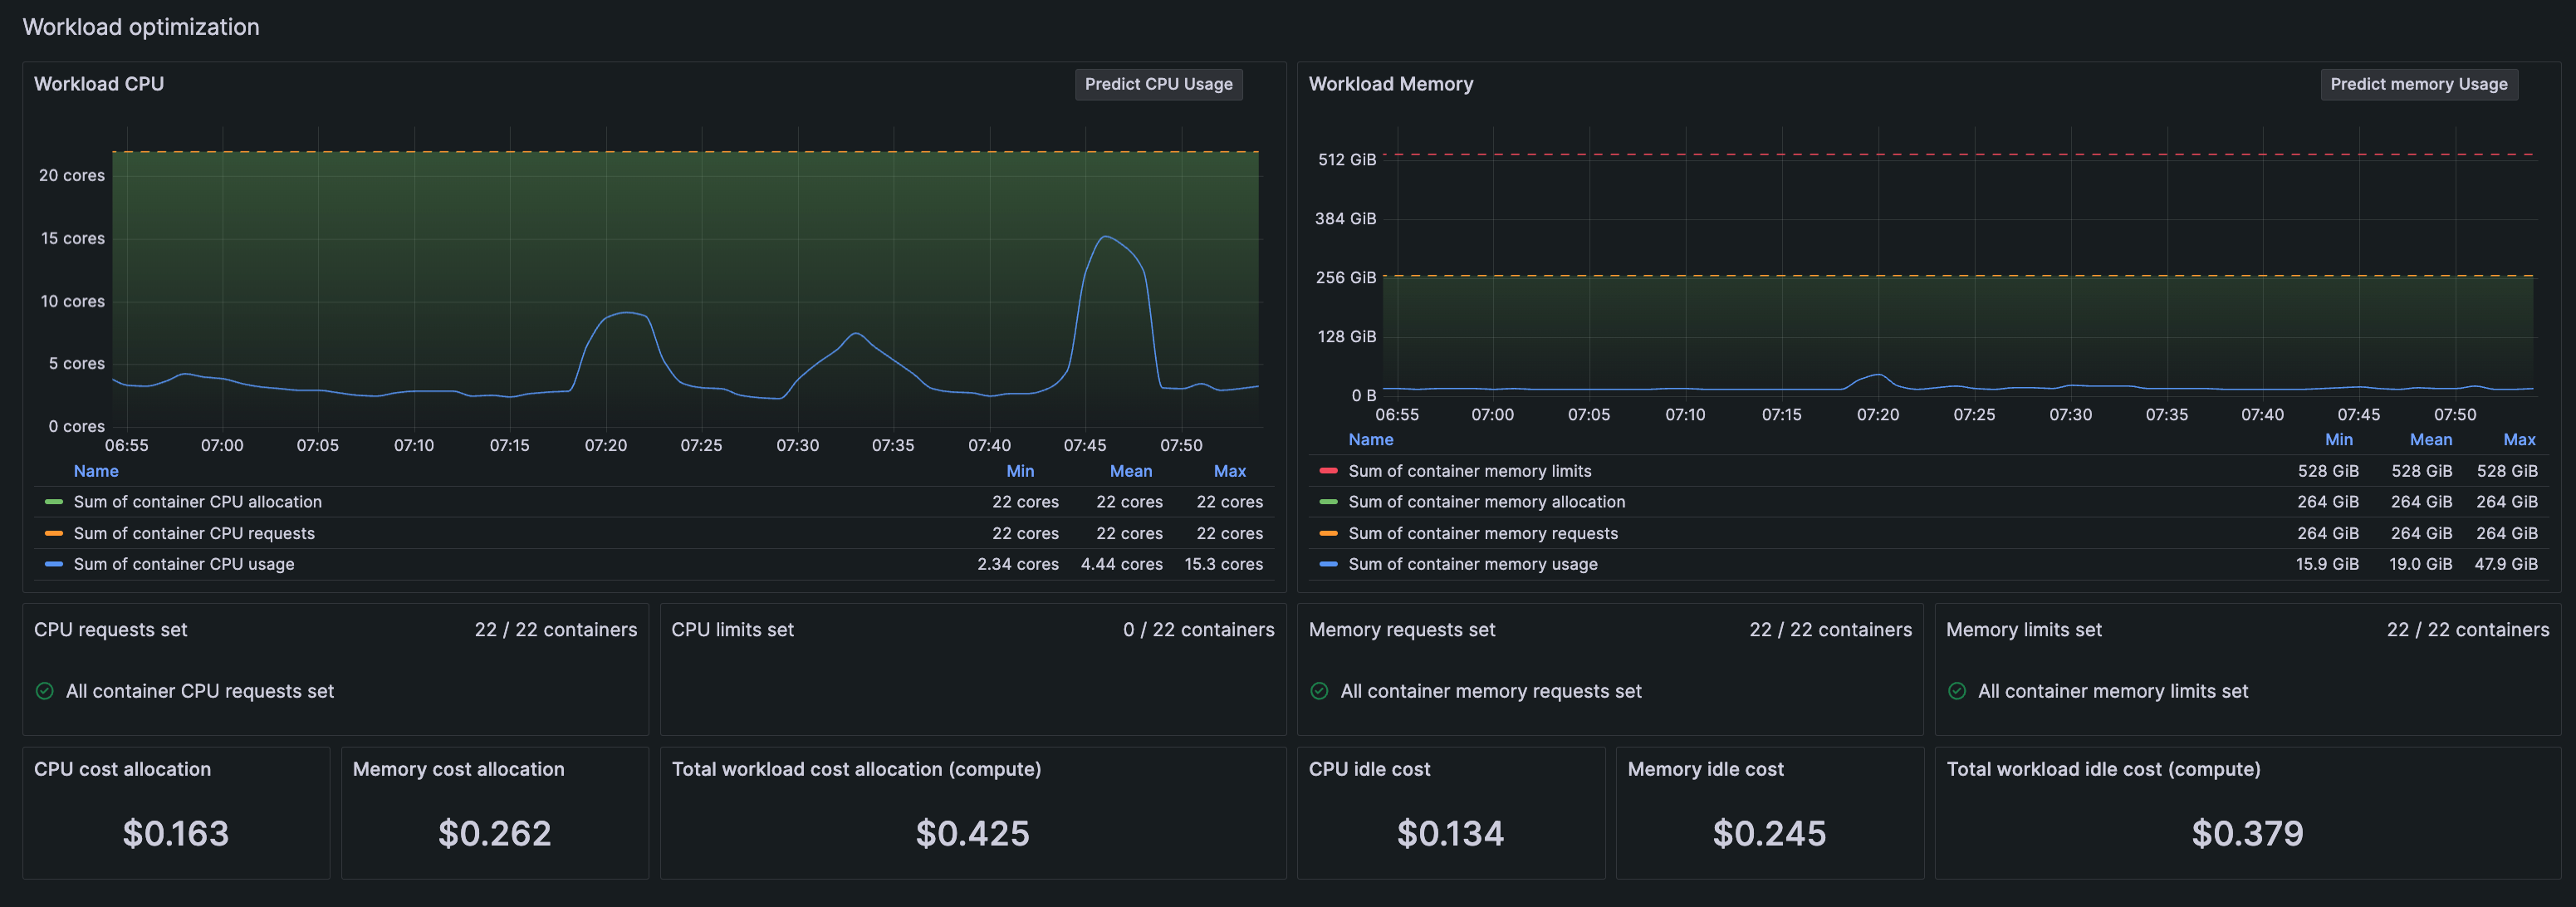
- Workload detail page
![]()
(Release 1.5.0)
View the details of any container, pod, workload & namespace with these improved pages, which include CPU and memory utilization graphs and cost details.
The container page also shows adjacent restart and termination panels so you can visually correlate more quickly the restart and termination events, along with the reason for termination.
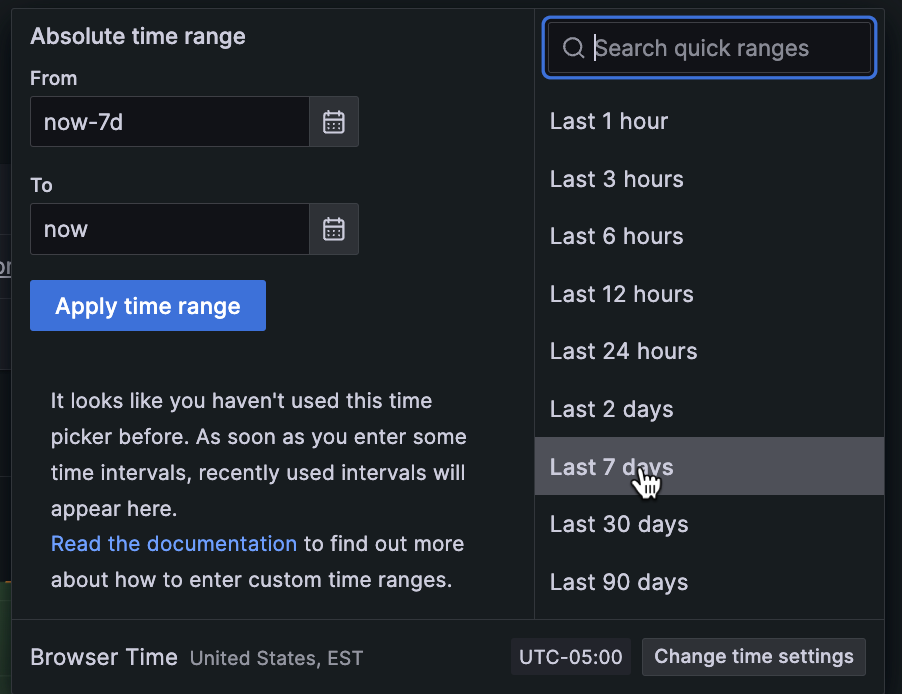
To aid in understanding historical data, a time range selector is available on every page of Kubernetes Monitoring where this function is appropriate. This selector is also available on the Workloads detail page, for detecting outlier CPU usage in the Pods. (Release 1.4.0)
Sometimes profile stacks contain lots of levels with similar repeating items, for example long stacks of framework code that usually isn’t of interest but takes up a lot of visual real estate. With this feature, instead of rendering all of the similar items we render only one and allow to expand those collapsed items on demand.
The Contact points list view has been redesigned and split into two tabs: Contact Points and Notification Templates, making it easier to view all contact point information at a glance. You can now search for name and type of contact points and integrations, view how many notification policies each contact point is being used for, and navigate directly to the linked notification policies.