
About Kafka integration pre-built dashboards
The Kafka integration provides a variety of pre-built dashboards that you can use right away to begin troubleshooting issues. In this milestone, you’ll become familiar with these pre-built dashboards and learn how to use them to address various problems.
The following dashboards are included with the Kafka integration:
Did you know? If you don’t see any metrics, try switching the data source using the drop-down at the top of the dashboard.
Kafka overview dashboard
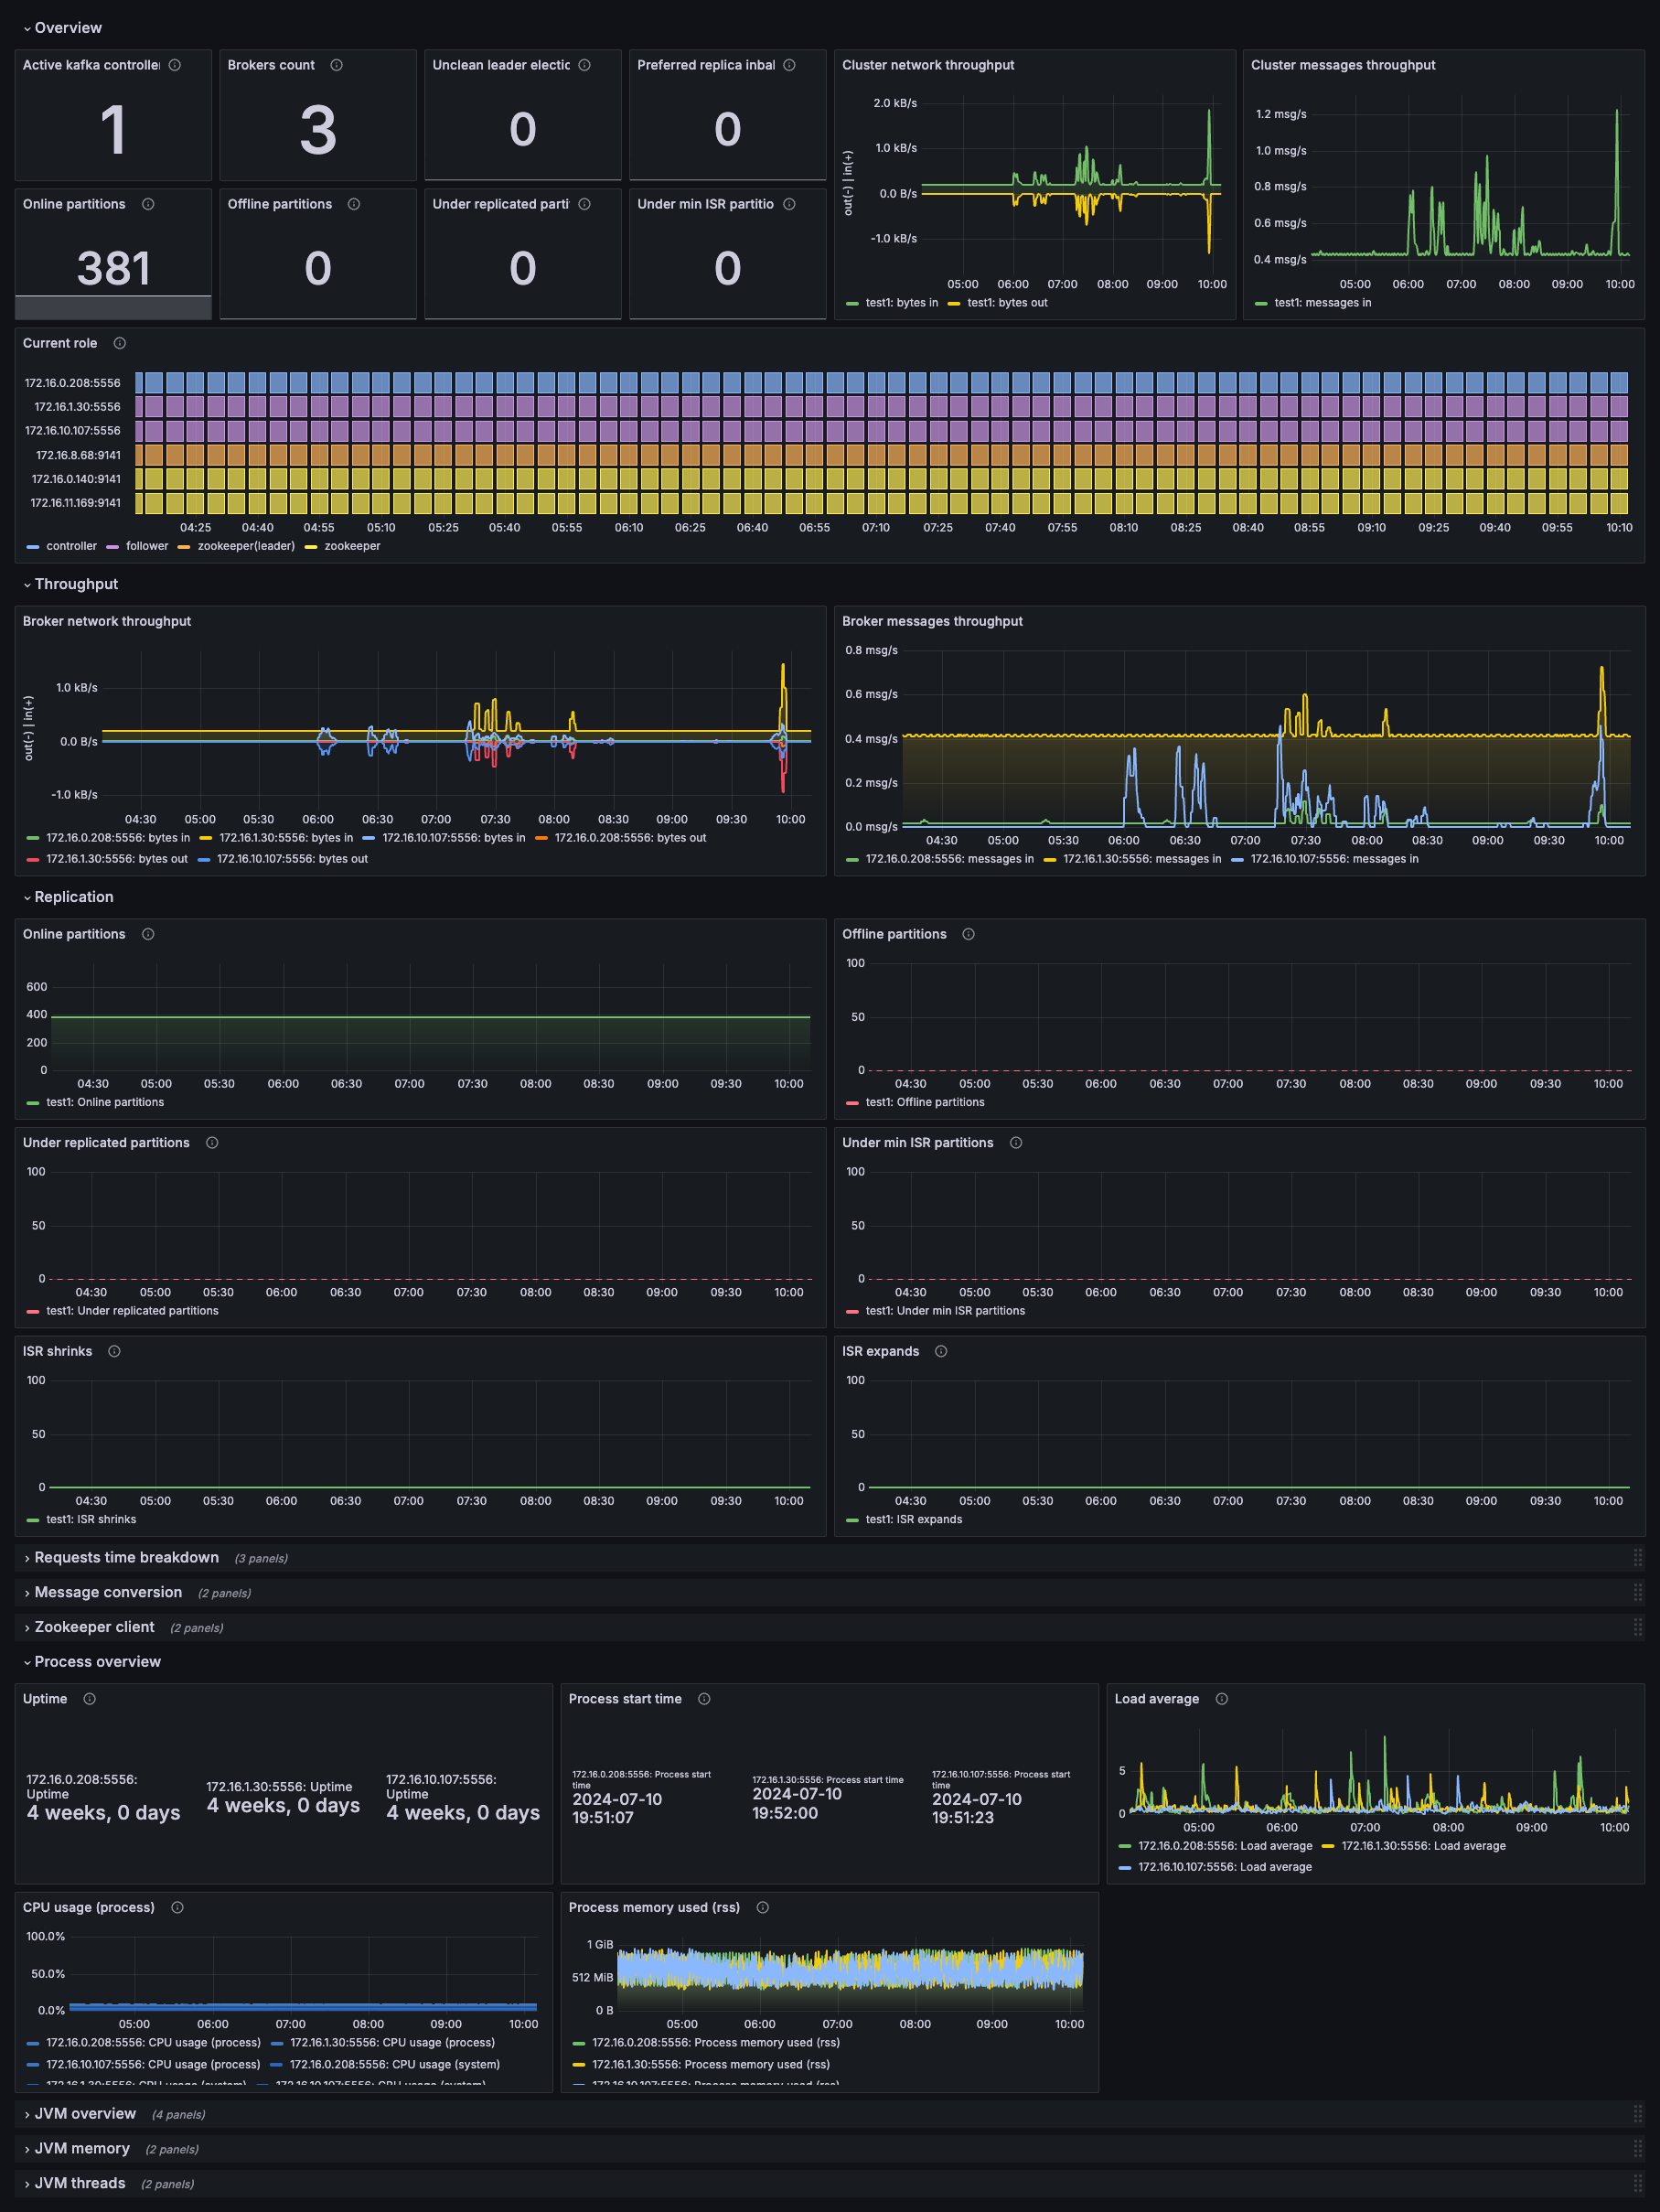
This dashboard offers a comprehensive overview of your Kafka cluster, including:
- Active Kafka controllers
- Broker count
- Partition health (unclean leader elections, preferred replica imbalances, partition distribution)
- Cluster throughput (bytes in and messages in)
- Current role (distribution of partition leadership across brokers)
- Broker throughput (network throughput and message rates per broker)
- Replication status (online, offline, under-replicated, and under min ISR partitions)
- Process overview (uptime, start times, load average)
- JVM overview (CPU and memory usage for broker JVM processes)
Use this dashboard to gain a high-level understanding of cluster operational status, quickly identify broker health issues, and monitor cluster-wide throughput trends.
Kafka topics dashboard
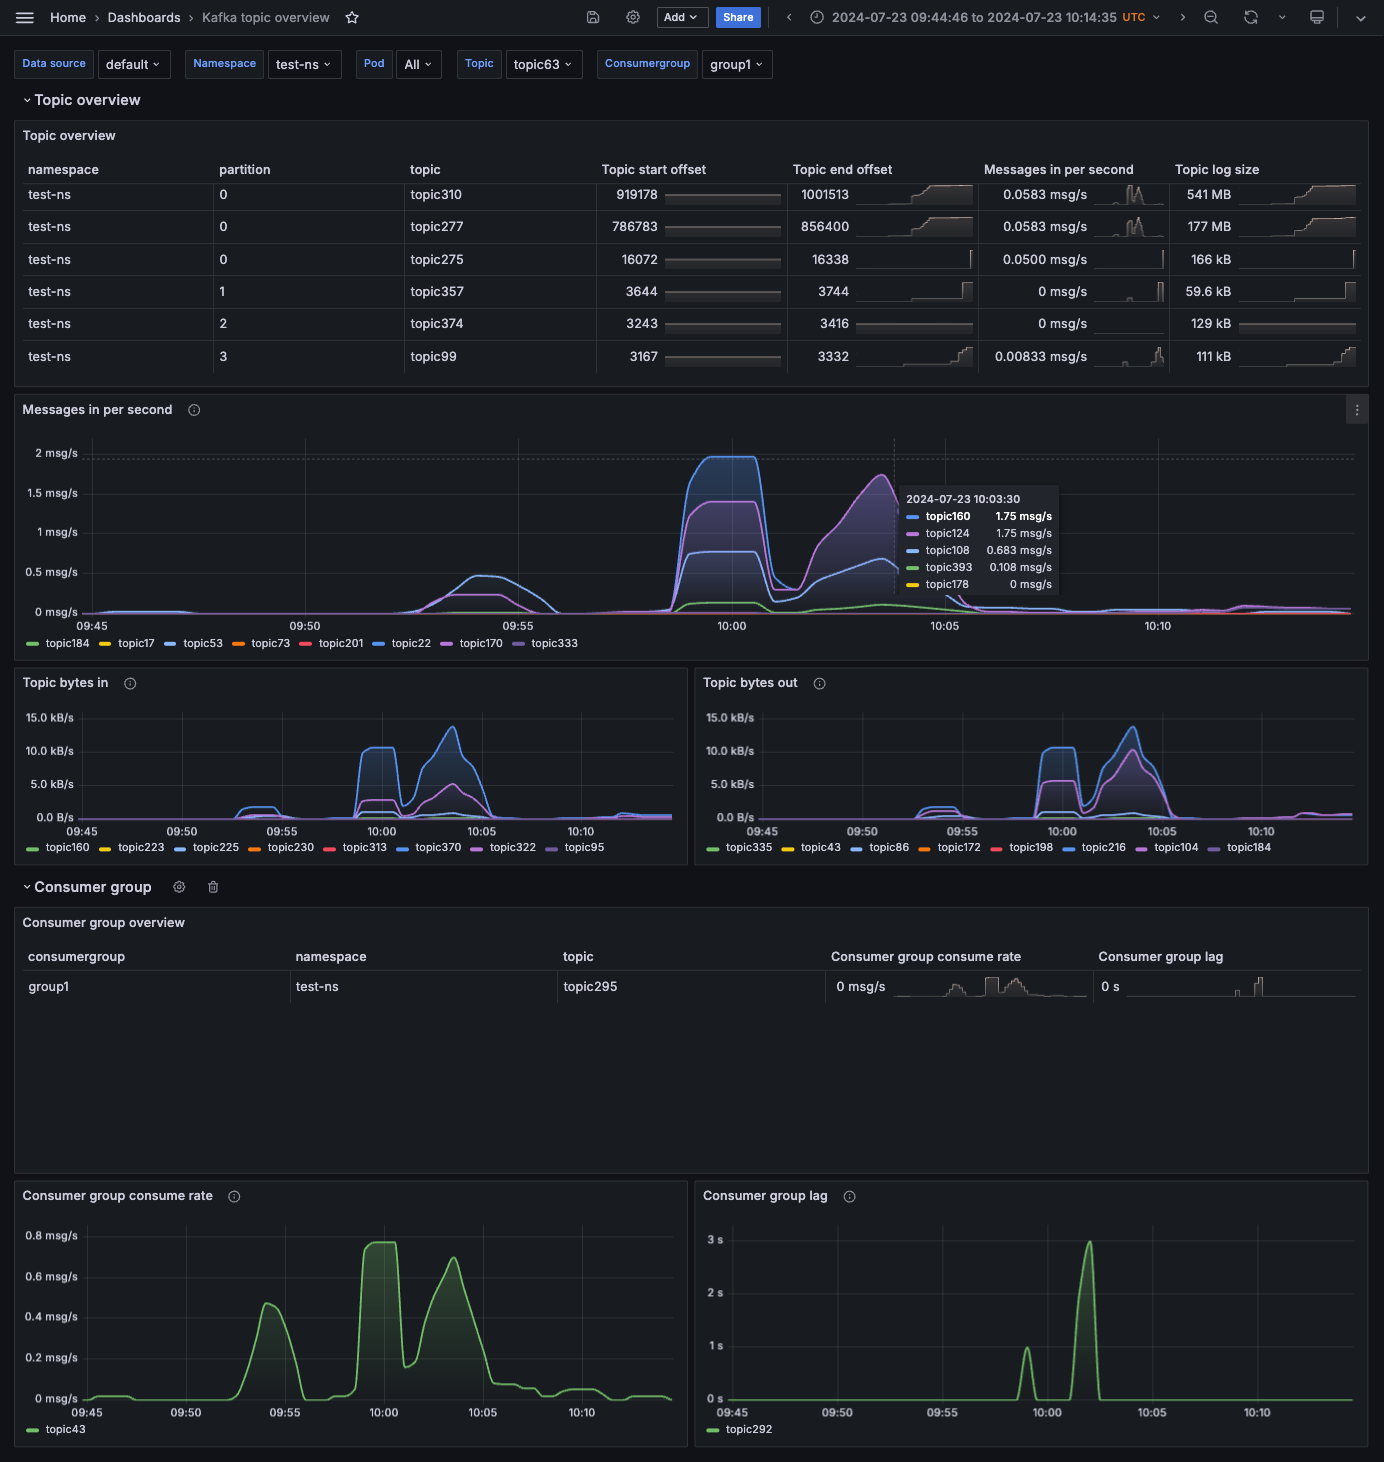
This dashboard shows detailed information about Kafka topics, including:
- Topic overview (namespace, partition, start/end offset, messages per second, log size)
- Messages per second (ingestion rate per topic over time)
- Topic bytes in/out (data transfer rates)
- Consumer group overview (groups, associated topics, consume rate, and lag)
- Consumer group metrics (consume rate and lag over time per group)
Use this dashboard to monitor topic-level performance, identify unusual message rates, track consumer lag, and analyze topic growth.
Kafka Connect overview dashboard
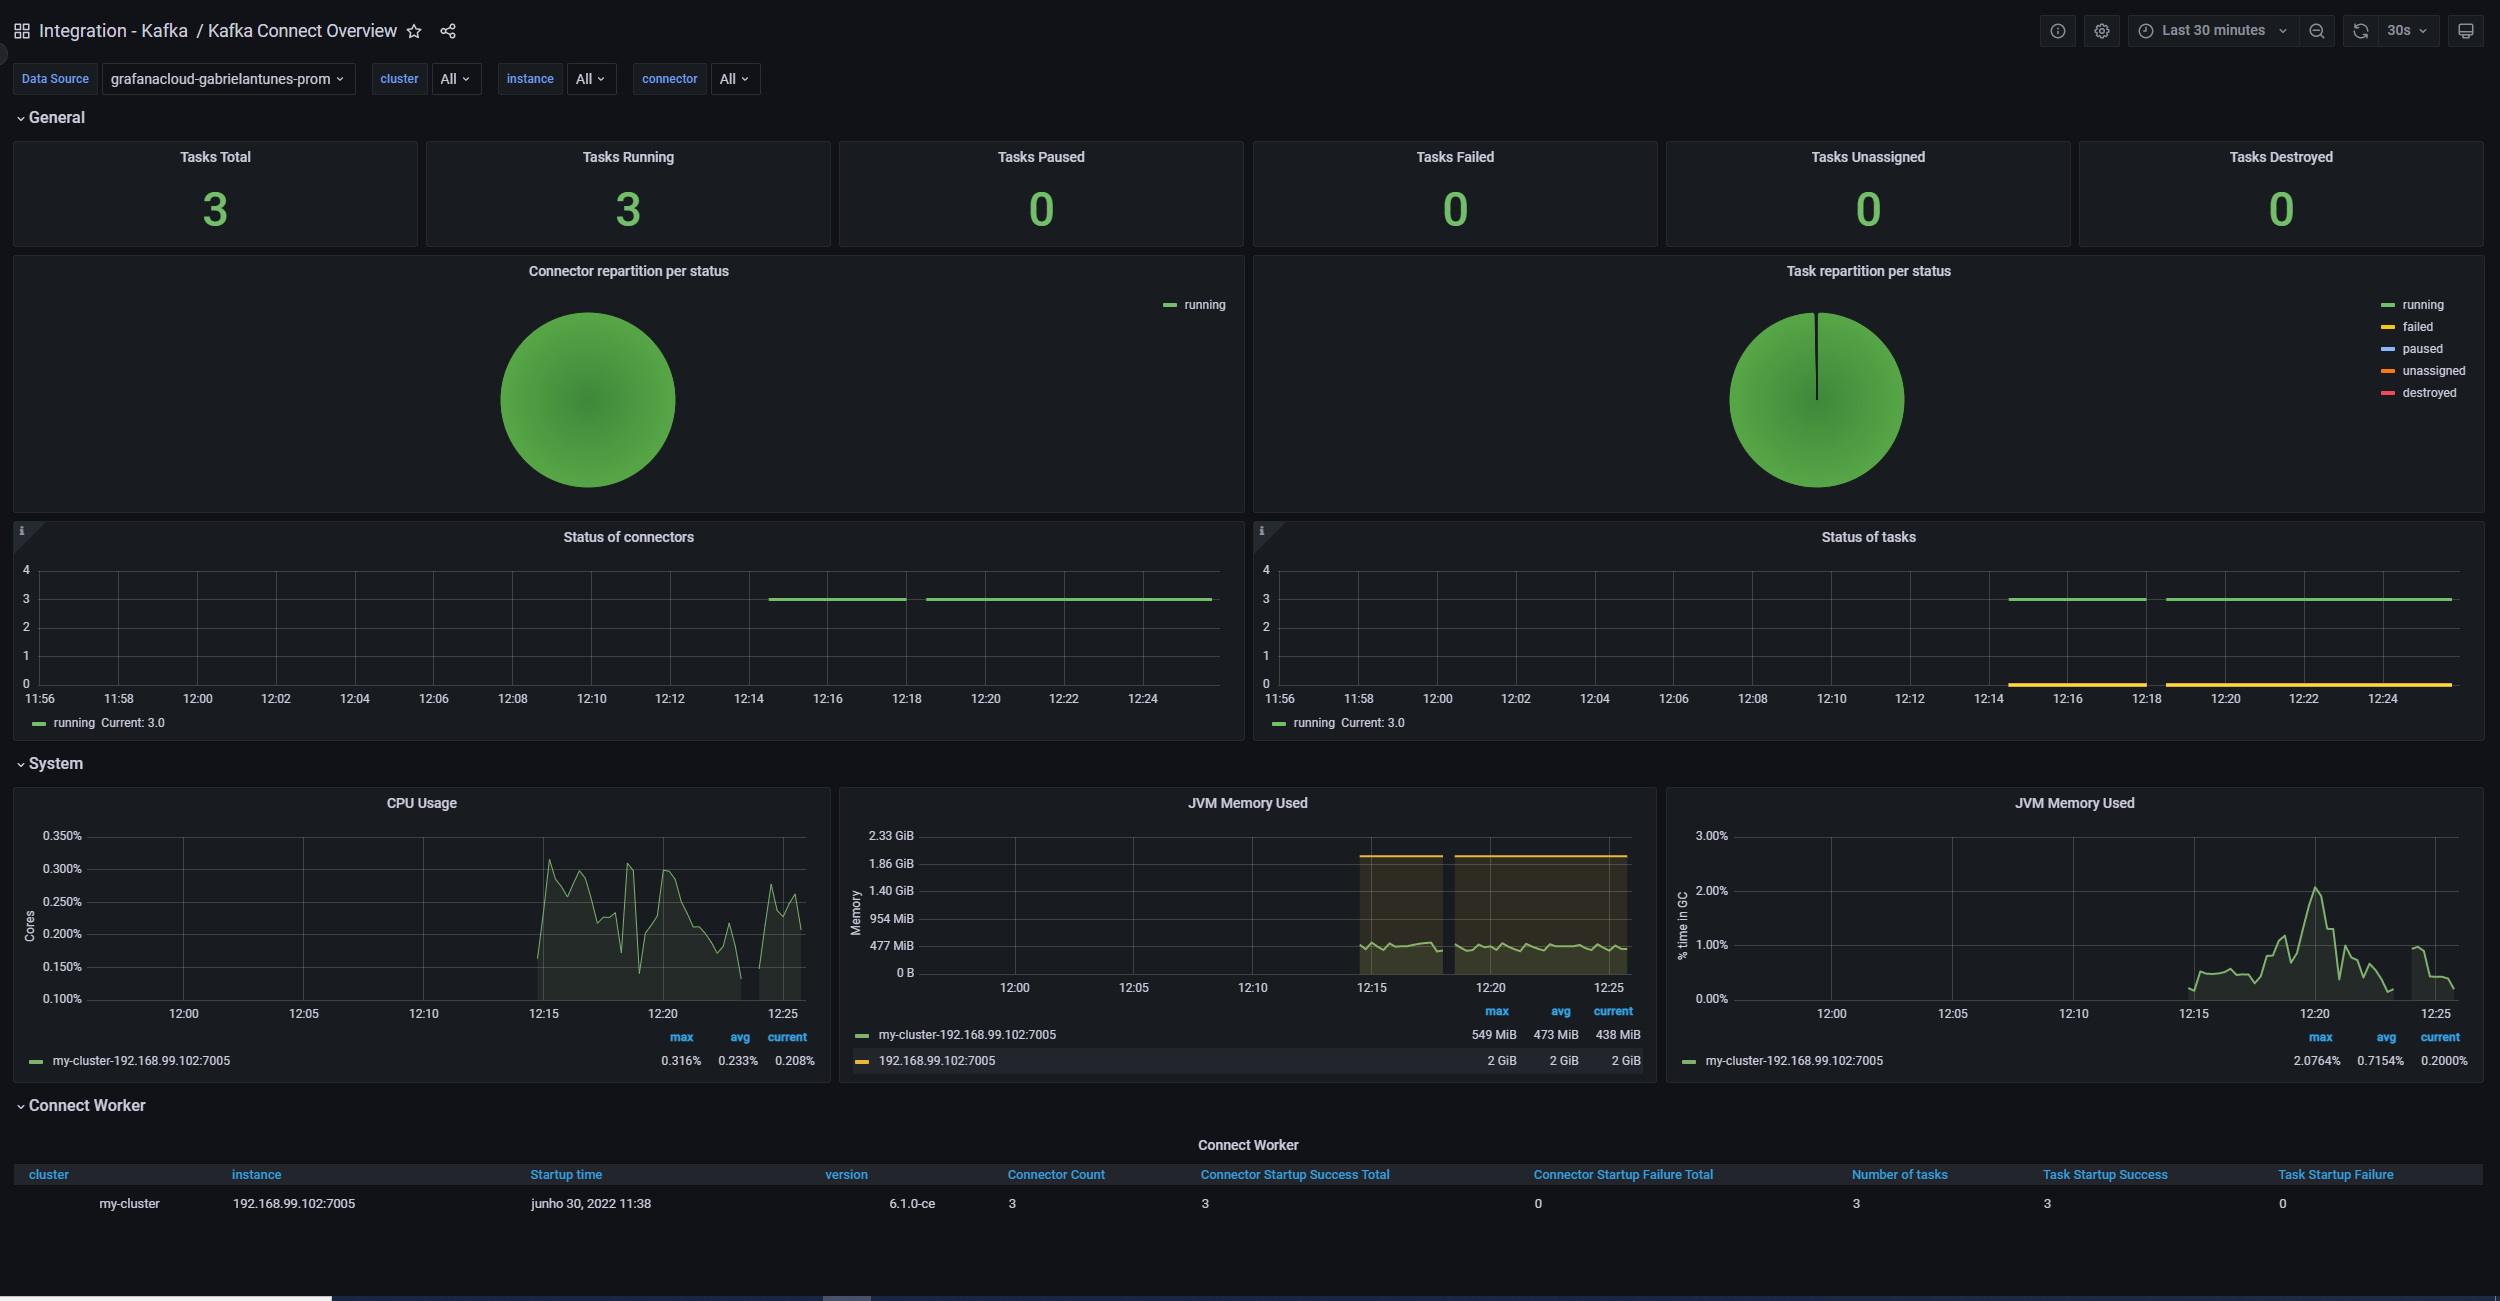
This dashboard displays information about Kafka Connect, including:
- General task status (total, running, paused, failed, unassigned, destroyed)
- Connector status (repartition of connectors and tasks per status)
- Status over time (time-series graphs of connector and task status)
- System metrics (CPU usage and JVM memory for Connect workers)
- Connect Worker table (cluster, instance, startup time, version, connector/task details)
Use this dashboard to monitor Kafka Connect health, track task execution status, identify failed connectors, and monitor resource usage.
In the next milestone, you learn about the pre-built alerts included with the Kafka integration.
More to explore (optional)
At this point in your journey, you can explore the following paths: