
Menu
Grafana Cloud
Enterprise
Open source
Library imports
Note
The Business Charts panel supports NPM library imports starting from version 6.0.0.
Since version 6.4.0, you can return
importwith options instead of using thesetOption(options)method.
You can import additional NPM libraries for use in the Business Charts panel using the import statement.
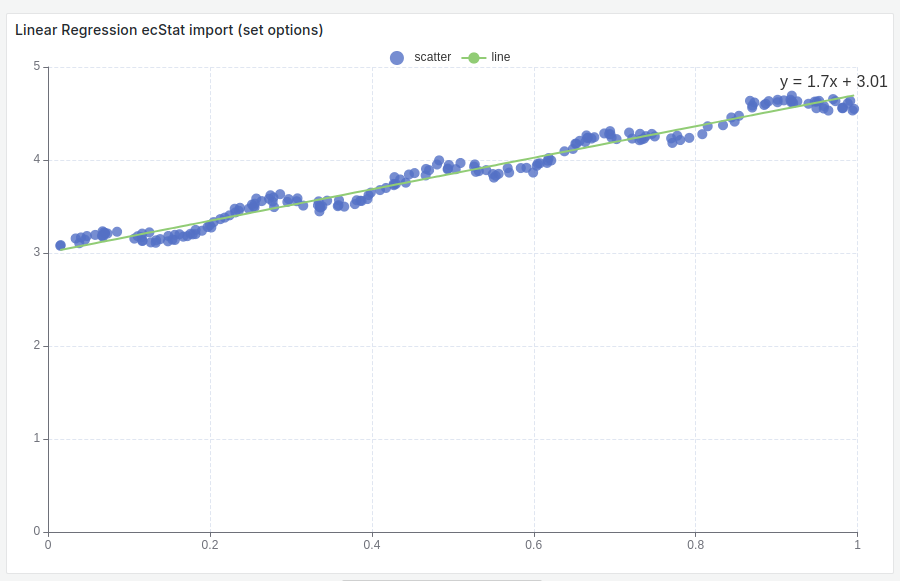
ecStat library
Additional libraries like ecStat can be loaded dynamically to provide additional functionality. In this example we use setOption(options) method in then method.
const options = {};

/**
 * echarts-stat import
 */
import("https://esm.sh/echarts-stat@1.2.0").then(
  ({ default: ecStatImport }) => {
    context.echarts.registerTransform(ecStatImport.transform.regression);

    /**
     * setOption method use
     */
    context.panel.chart.setOption(options);
  }
);
const values = [
[0.067732, 3.176513],
[0.42781, 3.816464],
[0.995731, 4.550095],
[0.738336, 4.256571],
[0.981083, 4.560815],
[0.526171, 3.929515],
[0.378887, 3.52617],
[0.033859, 3.156393],
[0.132791, 3.110301],
[0.138306, 3.149813],
[0.247809, 3.476346],
[0.64827, 4.119688],
[0.731209, 4.282233],
[0.236833, 3.486582],
[0.969788, 4.655492],
[0.607492, 3.965162],
[0.358622, 3.5149],
[0.147846, 3.125947],
[0.63782, 4.094115],
[0.230372, 3.476039],
[0.070237, 3.21061],
[0.067154, 3.190612],
[0.925577, 4.631504],
[0.717733, 4.29589],
[0.015371, 3.085028],
[0.33507, 3.44808],
[0.040486, 3.16744],
[0.212575, 3.364266],
[0.617218, 3.993482],
[0.541196, 3.891471],
[0.045353, 3.143259],
[0.126762, 3.114204],
[0.556486, 3.851484],
[0.901144, 4.621899],
[0.958476, 4.580768],
[0.274561, 3.620992],
[0.394396, 3.580501],
[0.87248, 4.618706],
[0.409932, 3.676867],
[0.908969, 4.641845],
[0.166819, 3.175939],
[0.665016, 4.26498],
[0.263727, 3.558448],
[0.231214, 3.436632],
[0.552928, 3.831052],
[0.047744, 3.182853],
[0.365746, 3.498906],
[0.495002, 3.946833],
[0.493466, 3.900583],
[0.792101, 4.238522],
[0.76966, 4.23308],
[0.251821, 3.521557],
[0.181951, 3.203344],
[0.808177, 4.278105],
[0.334116, 3.555705],
[0.33863, 3.502661],
[0.452584, 3.859776],
[0.69477, 4.275956],
[0.590902, 3.916191],
[0.307928, 3.587961],
[0.148364, 3.183004],
[0.70218, 4.225236],
[0.721544, 4.231083],
[0.666886, 4.240544],
[0.124931, 3.222372],
[0.618286, 4.021445],
[0.381086, 3.567479],
[0.385643, 3.56258],
[0.777175, 4.262059],
[0.116089, 3.208813],
[0.115487, 3.169825],
[0.66351, 4.193949],
[0.254884, 3.491678],
[0.993888, 4.533306],
[0.295434, 3.550108],
[0.952523, 4.636427],
[0.307047, 3.557078],
[0.277261, 3.552874],
[0.279101, 3.494159],
[0.175724, 3.206828],
[0.156383, 3.195266],
[0.733165, 4.221292],
[0.848142, 4.413372],
[0.771184, 4.184347],
[0.429492, 3.742878],
[0.162176, 3.201878],
[0.917064, 4.648964],
[0.315044, 3.510117],
[0.201473, 3.274434],
[0.297038, 3.579622],
[0.336647, 3.489244],
[0.666109, 4.237386],
[0.583888, 3.913749],
[0.085031, 3.22899],
[0.687006, 4.286286],
[0.949655, 4.628614],
[0.189912, 3.239536],
[0.844027, 4.457997],
[0.333288, 3.513384],
[0.427035, 3.729674],
[0.466369, 3.834274],
[0.550659, 3.811155],
[0.278213, 3.598316],
[0.918769, 4.692514],
[0.886555, 4.604859],
[0.569488, 3.864912],
[0.066379, 3.184236],
[0.335751, 3.500796],
[0.426863, 3.743365],
[0.395746, 3.622905],
[0.694221, 4.310796],
[0.27276, 3.583357],
[0.503495, 3.901852],
[0.067119, 3.233521],
[0.038326, 3.105266],
[0.599122, 3.865544],
[0.947054, 4.628625],
[0.671279, 4.231213],
[0.434811, 3.791149],
[0.509381, 3.968271],
[0.749442, 4.25391],
[0.058014, 3.19471],
[0.482978, 3.996503],
[0.466776, 3.904358],
[0.357767, 3.503976],
[0.949123, 4.557545],
[0.41732, 3.699876],
[0.920461, 4.613614],
[0.156433, 3.140401],
[0.656662, 4.206717],
[0.616418, 3.969524],
[0.853428, 4.476096],
[0.133295, 3.136528],
[0.693007, 4.279071],
[0.178449, 3.200603],
[0.199526, 3.299012],
[0.073224, 3.209873],
[0.286515, 3.632942],
[0.182026, 3.248361],
[0.621523, 3.995783],
[0.344584, 3.563262],
[0.398556, 3.649712],
[0.480369, 3.951845],
[0.15335, 3.145031],
[0.171846, 3.181577],
[0.867082, 4.637087],
[0.223855, 3.404964],
[0.528301, 3.873188],
[0.890192, 4.633648],
[0.106352, 3.154768],
[0.917886, 4.623637],
[0.014855, 3.078132],
[0.567682, 3.913596],
[0.068854, 3.221817],
[0.603535, 3.938071],
[0.53205, 3.880822],
[0.651362, 4.176436],
[0.901225, 4.648161],
[0.204337, 3.332312],
[0.696081, 4.240614],
[0.963924, 4.532224],
[0.98139, 4.557105],
[0.987911, 4.610072],
[0.990947, 4.636569],
[0.736021, 4.229813],
[0.253574, 3.50086],
[0.674722, 4.245514],
[0.939368, 4.605182],
[0.235419, 3.45434],
[0.110521, 3.180775],
[0.218023, 3.38082],
[0.869778, 4.56502],
[0.19683, 3.279973],
[0.958178, 4.554241],
[0.972673, 4.63352],
[0.745797, 4.281037],
[0.445674, 3.844426],
[0.470557, 3.891601],
[0.549236, 3.849728],
[0.335691, 3.492215],
[0.884739, 4.592374],
[0.918916, 4.632025],
[0.441815, 3.75675],
[0.116598, 3.133555],
[0.359274, 3.567919],
[0.814811, 4.363382],
[0.387125, 3.560165],
[0.982243, 4.564305],
[0.78088, 4.215055],
[0.652565, 4.174999],
[0.87003, 4.58664],
[0.604755, 3.960008],
[0.255212, 3.529963],
[0.730546, 4.213412],
[0.493829, 3.908685],
[0.257017, 3.585821],
[0.833735, 4.374394],
[0.070095, 3.213817],
[0.52707, 3.952681],
[0.116163, 3.129283],
];
const options = {
grid: {
bottom: "4%",
containLabel: true,
left: "3%",
right: "4%",
top: "4%",
},
dataset: [
{
source: values,
},
{
transform: {
type: "ecStat:regression",
// 'linear' by default.
// config: { method: 'linear', formulaOn: 'end' }
},
},
],
legend: {},
tooltip: {
trigger: "axis",
axisPointer: {
type: "cross",
},
},
xAxis: {
splitLine: {
lineStyle: {
type: "dashed",
},
},
},
yAxis: {
splitLine: {
lineStyle: {
type: "dashed",
},
},
},
series: [
{
name: "scatter",
type: "scatter",
},
{
name: "line",
type: "line",
datasetIndex: 1,
symbolSize: 0.1,
symbol: "circle",
label: { show: true, fontSize: 16 },
labelLayout: { dx: -20 },
encode: { label: 2, tooltip: 1 },
},
],
};
/**
* echarts-stat import
*/
import("https://esm.sh/echarts-stat@1.2.0").then(
({ default: ecStatImport }) => {
context.echarts.registerTransform(ecStatImport.transform.regression);
/**
* setOption method use
*/
context.panel.chart.setOption(options);
}
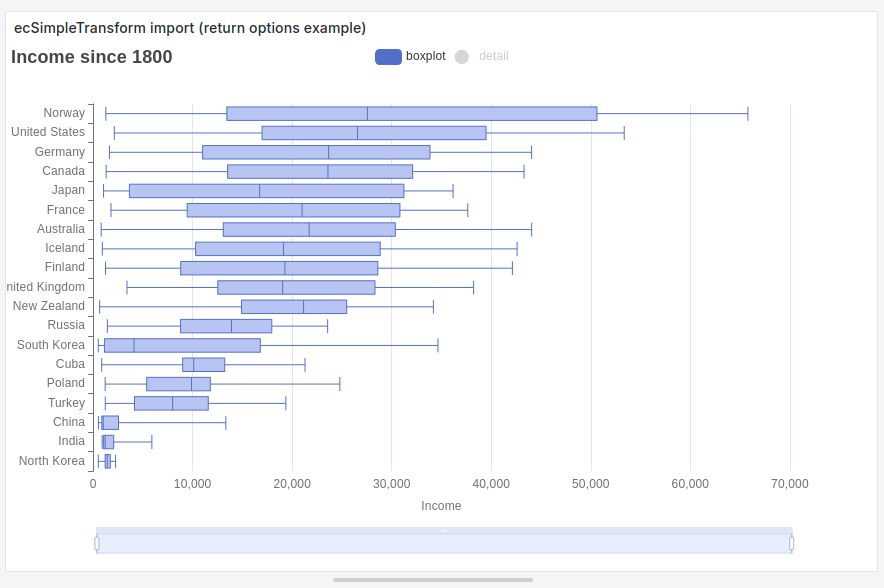
);ecSimpleTransform library
For next example we use JSON API data source and data example from Apache ECharts website.
Code example for version 6.4.0 and above:
/**
 * echarts-simple-transform import
 */
return import("https://esm.sh/@manufac/echarts-simple-transform@2.0.11").then(
  ({ default: ecSimpleTransform }) => {
    context.echarts.registerTransform(ecSimpleTransform.aggregate);

    /**
     * return options
     */
    return options;
  }
);
const dataSetTest = context.panel.data.series[0].fields[0].values;

const options = {
  dataset: [
    {
      id: "raw",
      source: dataSetTest,
    },
    {
      id: "since_year",
      fromDatasetId: "raw",
      transform: [
        {
          type: "filter",
          config: {
            dimension: "Year",
            gte: 1799,
          },
        },
      ],
    },
    {
      id: "income_aggregate",
      fromDatasetId: "since_year",
      transform: [
        {
          type: "ecSimpleTransform:aggregate",
          config: {
            resultDimensions: [
              { name: "min", from: "Income", method: "min" },
              { name: "Q1", from: "Income", method: "Q1" },
              { name: "median", from: "Income", method: "median" },
              { name: "Q3", from: "Income", method: "Q3" },
              { name: "max", from: "Income", method: "max" },
              { name: "Country", from: "Country" },
            ],
            groupBy: "Country",
          },
        },
        {
          type: "sort",
          config: {
            dimension: "Q3",
            order: "asc",
          },
        },
      ],
    },
  ],
  title: {
    text: "Income since 1800",
  },
  tooltip: {
    trigger: "axis",
    confine: true,
  },
  xAxis: {
    name: "Income",
    nameLocation: "middle",
    nameGap: 30,
    scale: true,
  },
  yAxis: {
    type: "category",
  },
  grid: {
    bottom: 100,
  },
  legend: {
    selected: { detail: false },
  },
  dataZoom: [
    {
      type: "inside",
    },
    {
      type: "slider",
      height: 20,
    },
  ],
  series: [
    {
      name: "boxplot",
      type: "boxplot",
      datasetId: "income_aggregate",
      itemStyle: {
        color: "#b8c5f2",
      },
      encode: {
        x: ["min", "Q1", "median", "Q3", "max"],
        y: "Country",
        itemName: ["Country"],
        tooltip: ["min", "Q1", "median", "Q3", "max"],
      },
    },
    {
      name: "detail",
      type: "scatter",
      datasetId: "since_year",
      symbolSize: 6,
      tooltip: {
        trigger: "item",
      },
      label: {
        show: true,
        position: "top",
        align: "left",
        verticalAlign: "middle",
        rotate: 90,
        fontSize: 12,
      },
      itemStyle: {
        color: "#d00000",
      },
      encode: {
        x: "Income",
        y: "Country",
        label: "Year",
        itemName: "Year",
        tooltip: ["Country", "Year", "Income"],
      },
    },
  ],
};

/**
 * echarts-simple-transform import
 */
return import("https://esm.sh/@manufac/echarts-simple-transform@2.0.11").then(
  ({ default: ecSimpleTransform }) => {
    context.echarts.registerTransform(ecSimpleTransform.aggregate);

    /**
     * return options
     */
    return options;
  }
);

