
Plugins 〉Google Cloud Trace
Google Cloud Trace


Google Cloud Trace Data Source
Overview
The Google Cloud Trace Data Source is a backend data source plugin for Grafana, which allows users to query and visualize their Google Cloud traces and spans in Grafana.
Supported Grafana Version
9.0.x+
Setup
Download
Download this plugin to the machine Grafana is running on, either using git clone or simply downloading it as a ZIP file. For the purpose of this guide, we'll assume the user "alice" has downloaded it into their local directory "/Users/alice/grafana/". If you are running the Grafana server using a user such as grafana, make sure the user has access to the directory.
Enable Cloud Resource Manager API
You need to enable the resource manager API. Otherwise, your cloud projects will not be displayed in the dropdown menu.
You can follow the steps to enable it:
- Navigate to the cloud resource manager API page in GCP and select your project
- Press the
Enablebutton
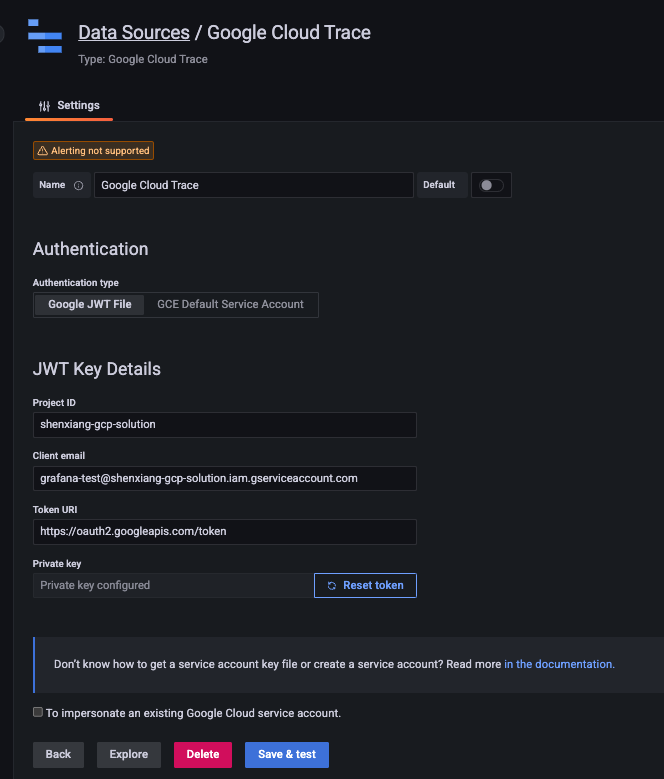
Authentication
The plugin supports multiple authentication methods. You can select the authentication type from the dropdown in the configuration editor.
Google JWT File
- If you don't have gcp project, add a new gcp project. link
- Open the Credentials page in the Google API Console
- Click Create Credentials then click Service account
- On the Create service account page, enter the Service account details
- On the
Create service accountpage, fill in theService account detailsand then clickCreate and Continue - On the
Grant this service account access to projectsection, add theCloud Trace Userrole underCloud Traceto the service account. ClickDone - In the next step, click the service account you just created. Under the
Keystab and selectAdd keyandCreate new key - Choose key type
JSONand clickCreate. A JSON key file will be created and downloaded to your computer
If you want to access traces in multiple cloud projects, you need to ensure the service account has permission to read logs from all of them.
GCE Default Service Account
If you host Grafana on a GCE VM, you can use the Compute Engine service account. You need to make sure the service account has sufficient permissions to access the traces in all projects.
Access Token
Similar to Prometheus data sources on Google Cloud, you can configure a scheduled job to use an OAuth2 access token to view the traces. Please follow the steps in the data source syncer README to configure it.
OAuth Passthrough
OAuth Passthrough lets users authenticate with their own Google OAuth identity through Grafana. This requires Grafana to be configured with a Google OAuth provider that has the https://www.googleapis.com/auth/cloud-platform.read-only scope. When enabled, the plugin forwards the user's browser OAuth token to GCP on each request.
Note: When using OAuth Passthrough, you must provide a Default Project ID in the configuration since the plugin cannot auto-detect the project from forwarded credentials.
Service Account Impersonation
You can also configure the plugin to use service account impersonation.
You need to ensure the service account used by this plugin has the iam.serviceAccounts.getAccessToken permission. This permission is in roles like the Service Account Token Creator role (roles/iam.serviceAccountTokenCreator). Also, the service account impersonated
by this plugin needs cloud trace user and project list permissions.
Note: Service account impersonation is available with JWT and GCE authentication types, but not with OAuth Passthrough.
Universe Domain
If you are using a non-default universe (e.g., a sovereign cloud), you can configure the Universe Domain field in the data source settings. Leave it empty to use the default (googleapis.com).
Grafana Configuration
- With Grafana restarted, navigate to
Configuration -> Data sources(or the route/datasources) - Click "Add data source"
- Select "Google Cloud Trace"
- Select the authentication type from the dropdown (JWT, GCE, Access Token, or OAuth Passthrough)
- Provide the required credentials for your chosen authentication method
- Click "Save & test" to test that traces can be queried from Cloud Trace.
Usage
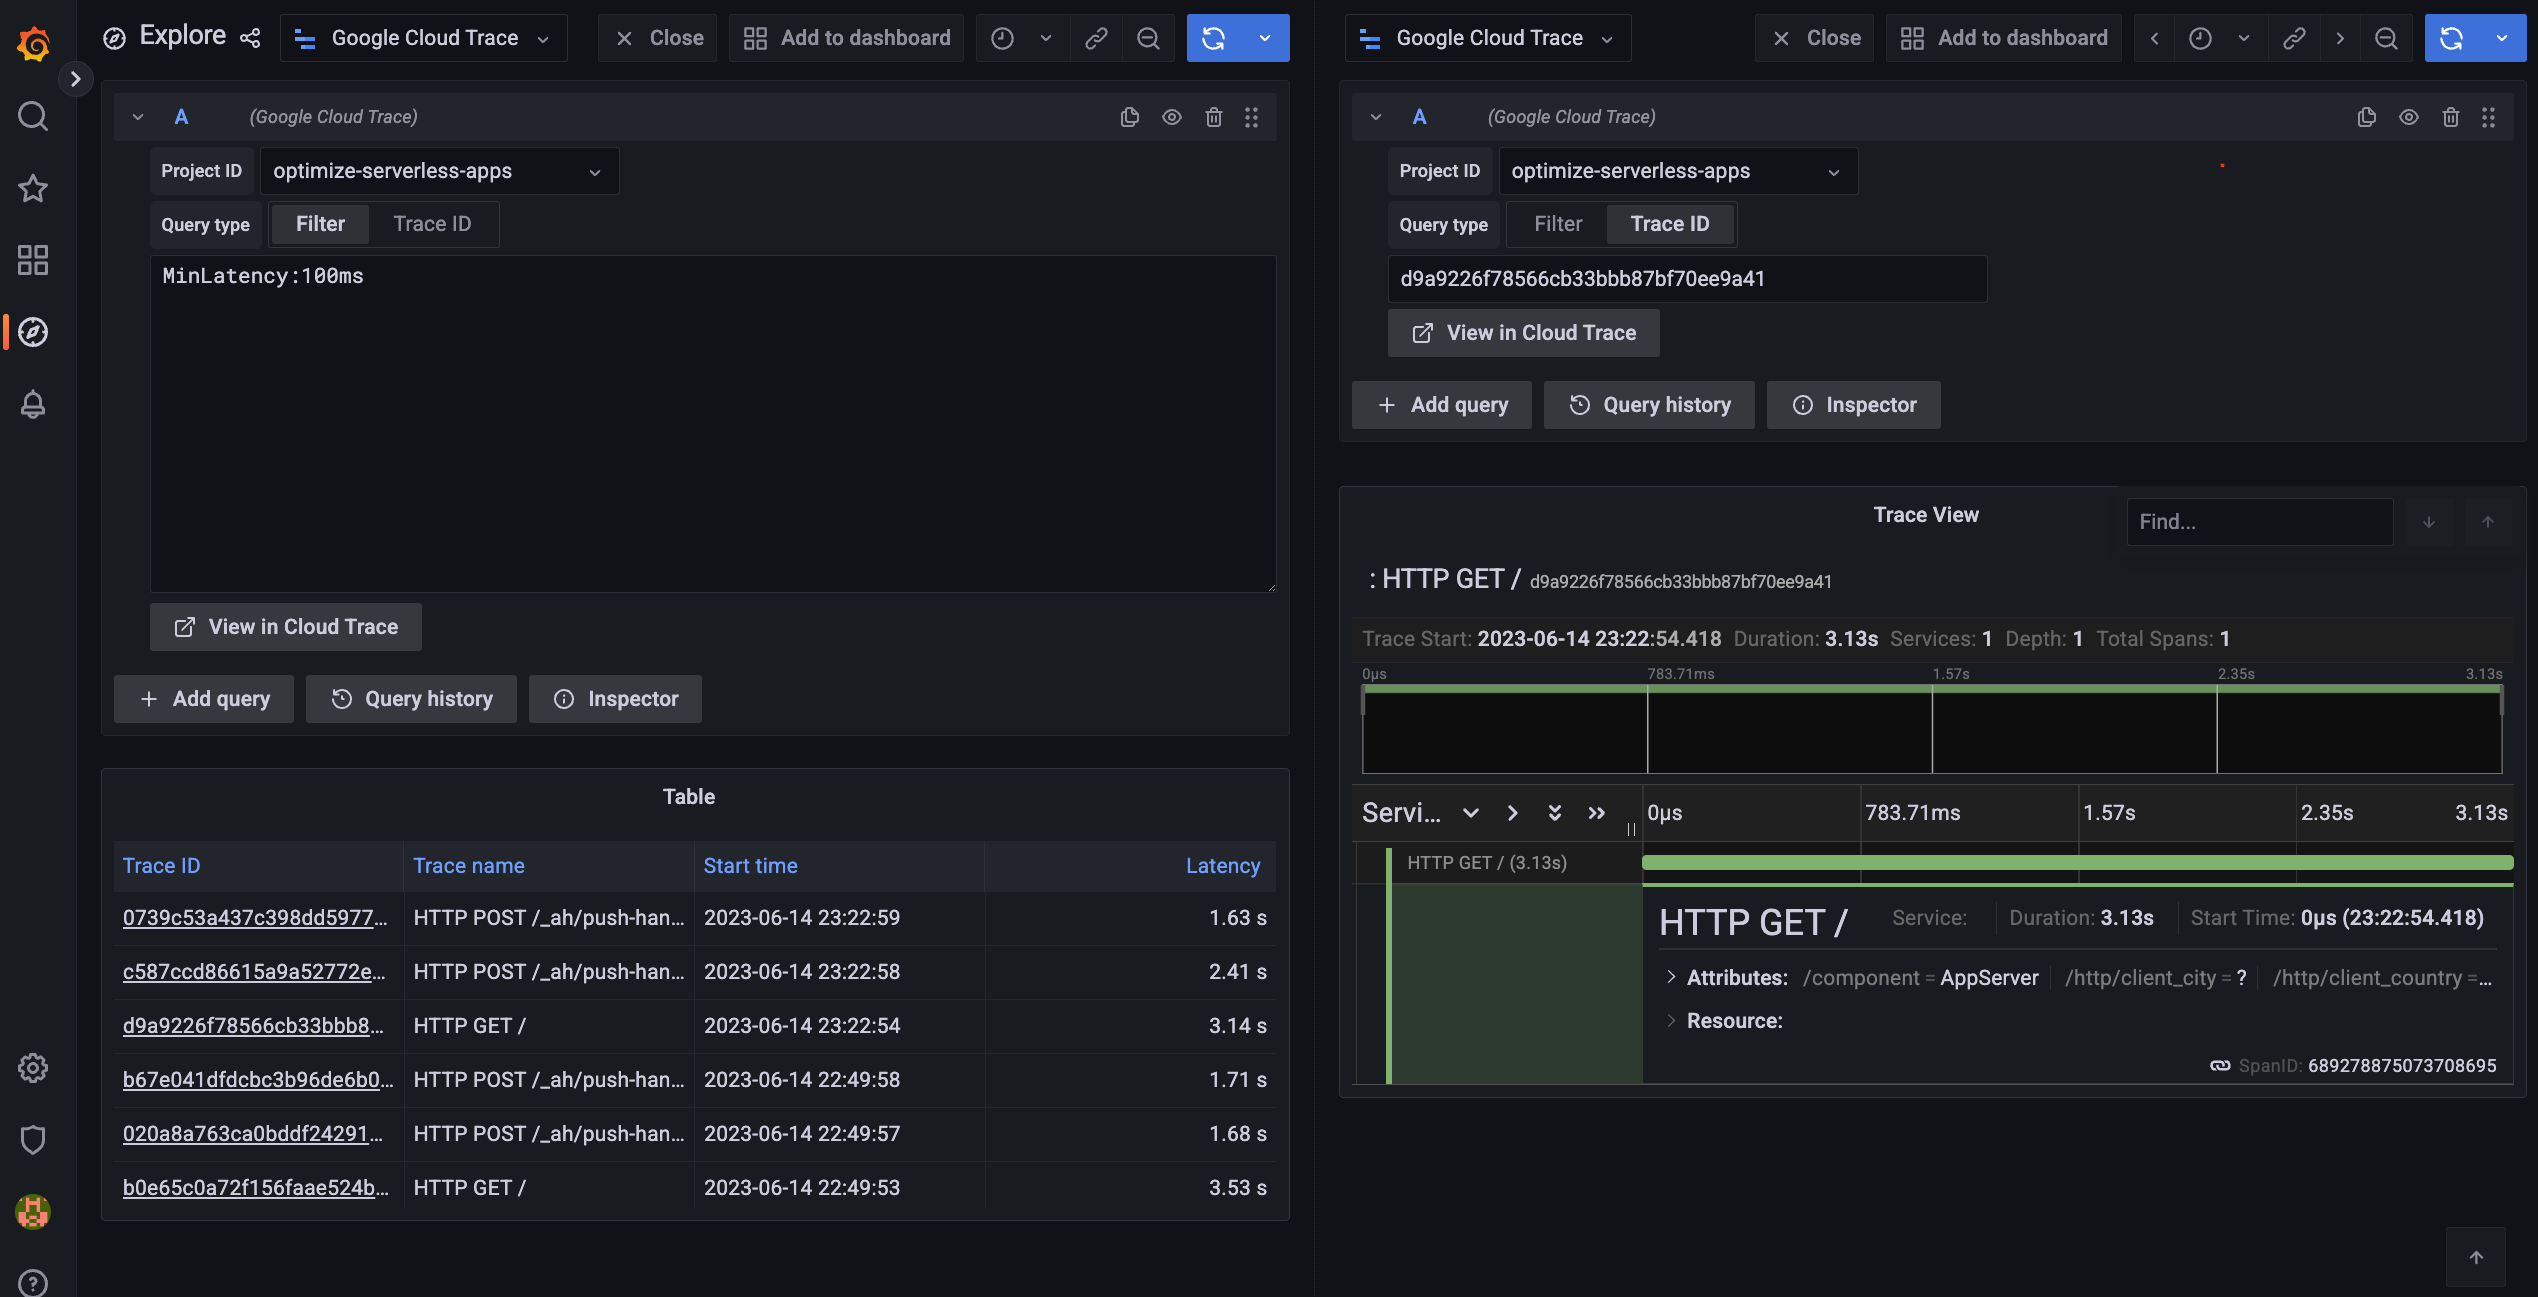
Grafana Explore
After configuration, navigate to
Explore(or the route/explore).Select "Google Cloud Trace" from the dropdown list of datasources.
Select either
FilterorTrace IDfor the query type.For
Trace IDqueries, simply enter in a trace ID to view the trace and its associated spans.For
Filterqueries, enter any number of filters in the form of[key]:[value]. Typically these filters are are used to match labels on the traces. These filters are additive. There are also a number of special user friendly keys you can use:RootSpanmatches any trace which contains the given root span nameSpanNamematches any trace which contains the given span nameHasLabelmatches any trace which contains the given label keyMinLatencymatches any trace which has a latency greater than the given latencyVersionmatches any trace which contains the labelg.co/gae/app/versionwith the given service versionServicematches any trace which contains the labelg.co/gae/app/modulewith the given service nameStatusmatches any trace which contains the label/http/status_codewith the given statusURLmatches any trace which contains the label/http/urlwith the given urlMethodmatches any trace which contains the label/http/methodwith the given HTTP method
After making a
Filterquery, a table will be displayed with all of the matching traces (Example:http.scheme:http http.server_name:testserver MinLatency:500ms)
Annotations
The plugin supports Grafana annotations. You can use trace queries as annotation sources to overlay trace data on your dashboards.
Supported variables
The plugin currently supports variables for the GCP projects and a trace id. The project variable is a query one, and the trace id is a text or custom one.
Development
Prerequisites
- Node.js >= 20
- Go >= 1.25
- Mage
Building
# Frontend
yarn install
yarn build
Backend
mage -v
Testing
# Frontend tests
yarn test:ci
Backend tests
go test ./pkg/…
Licenses
Cloud Trace Logo (src/img/logo.svg) is from Google Cloud's Official icons and sample diagrams
As commented, JWTForm and JWTConfigEditor are largely based on Apache-2.0 licensed grafana-google-sdk-react
Grafana Cloud Free
- Free tier: Limited to 3 users
- Paid plans: $55 / user / month above included usage
- Access to all Enterprise Plugins
- Fully managed service (not available to self-manage)
Self-hosted Grafana Enterprise
- Access to all Enterprise plugins
- All Grafana Enterprise features
- Self-manage on your own infrastructure
Installing Google Cloud Trace on Grafana Cloud:
Installing plugins on a Grafana Cloud instance is a one-click install; same with updates. Cool, right?
Note that it could take up to 1 minute to see the plugin show up in your Grafana.
Warning
Plugin installation from this page will be removed in February 2026. Use the Plugin Catalog in your Grafana instance instead. Refer to Install a plugin in the Grafana documentation for more information.
Installing plugins on a Grafana Cloud instance is a one-click install; same with updates. Cool, right?
Note that it could take up to 1 minute to see the plugin show up in your Grafana.
Installing plugins on a Grafana Cloud instance is a one-click install; same with updates. Cool, right?
Note that it could take up to 1 minute to see the plugin show up in your Grafana.
Warning
Plugin installation from this page will be removed in February 2026. Use the Plugin Catalog in your Grafana instance instead. Refer to Install a plugin in the Grafana documentation for more information.
Installing plugins on a Grafana Cloud instance is a one-click install; same with updates. Cool, right?
Note that it could take up to 1 minute to see the plugin show up in your Grafana.
For more information, visit the docs on plugin installation.
Installing on a local Grafana:
For local instances, plugins are installed and updated via a simple CLI command. Plugins are not updated automatically, however you will be notified when updates are available right within your Grafana.
1. Install the Data Source
Use the grafana-cli tool to install Google Cloud Trace from the commandline:
grafana-cli plugins install The plugin will be installed into your grafana plugins directory; the default is /var/lib/grafana/plugins. More information on the cli tool.
Alternatively, you can manually download the .zip file for your architecture below and unpack it into your grafana plugins directory.
Alternatively, you can manually download the .zip file and unpack it into your grafana plugins directory.
2. Configure the Data Source
Accessed from the Grafana main menu, newly installed data sources can be added immediately within the Data Sources section.
Next, click the Add data source button in the upper right. The data source will be available for selection in the Type select box.
To see a list of installed data sources, click the Plugins item in the main menu. Both core data sources and installed data sources will appear.
Changelog
1.3.2 (2026-03-18)
- Fix project dropdown search failing with "contains global restriction" error
- Return error responses as JSON so Grafana displays actual error messages instead of generic "Unexpected error"
- Suppress duplicate error toast notifications — errors now only appear in the inline alert
- Fix inline error alert showing raw JSON instead of the error message text
1.3.1 (2026-03-15)
- Improve project dropdown performance with AsyncSelect and server-side search
- Cache default project list to reduce redundant backend requests
- Cap ListProjects results to 100 for performance
- Use Grafana UI components (Field, Input, Alert) in ConfigEditor and QueryEditor
- Fix log levels from Warn to Error for GCE and ListProjects errors
- Add request URL parsing for project search query support
- Add .gitattributes for GitHub language statistics
- Enhance filterQuery to skip empty traceID and missing projectId queries
- Add null safety guard in addLinksToTraceIdColumn
- Persist default query values via onChange in QueryEditor
- Fix resource leak: close trace client when resource manager init fails
- Fix direct props mutation in ConfigEditor service account impersonation
1.3.0 (2026-03-09)
- Support OAuth passthrough authentication
- Add universe domain support
- Add HTML error sanitization (frontend and backend)
- Add pagination to ListProjects using gRPC v3 Resource Manager client
- Add annotation support
- Improve error responses in CallResource (return proper HTTP status codes)
- Add authentication type selector dropdown in ConfigEditor
- Migrate build tooling from @grafana/toolkit to webpack
- Update dependencies
1.2.0 (2025-04-08)
- Support new Access Token auth type
1.1.0 (2023-10-07)
- Support service account impersonation
- Support the project and trace id variables
- Update dependencies
1.0.0 (2023-06-16)
Initial release.