
NetXMS Data Source Plugin for Grafana



The NetXMS Data Source Plugin enables Grafana to visualize data from NetXMS, an open-source network management and monitoring platform. This plugin allows you to query alarms, DCI values, summary tables, and more, directly from your NetXMS server.
Features
- Query NetXMS alarms
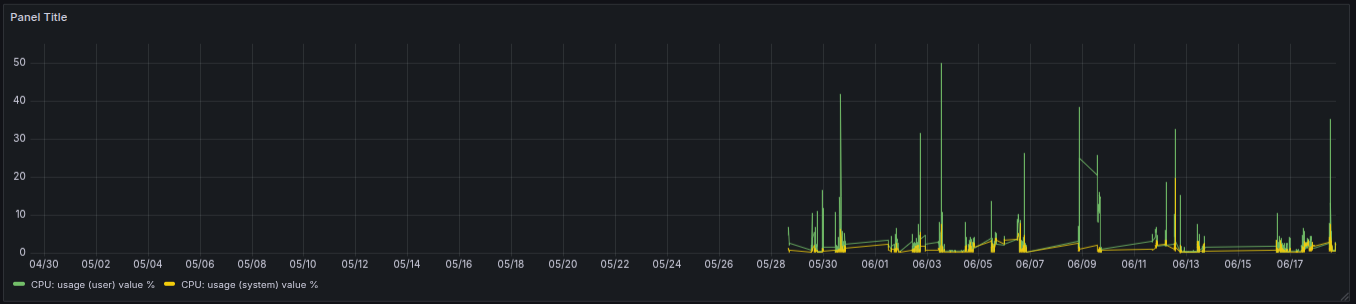
- Show DCI values
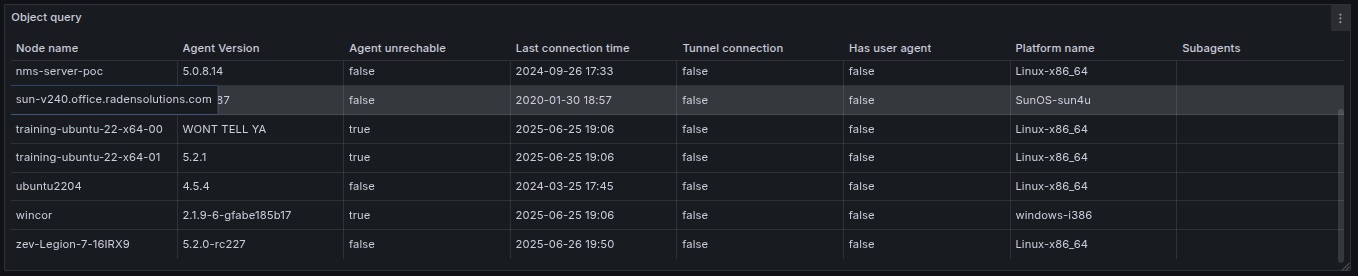
- Query summary tables
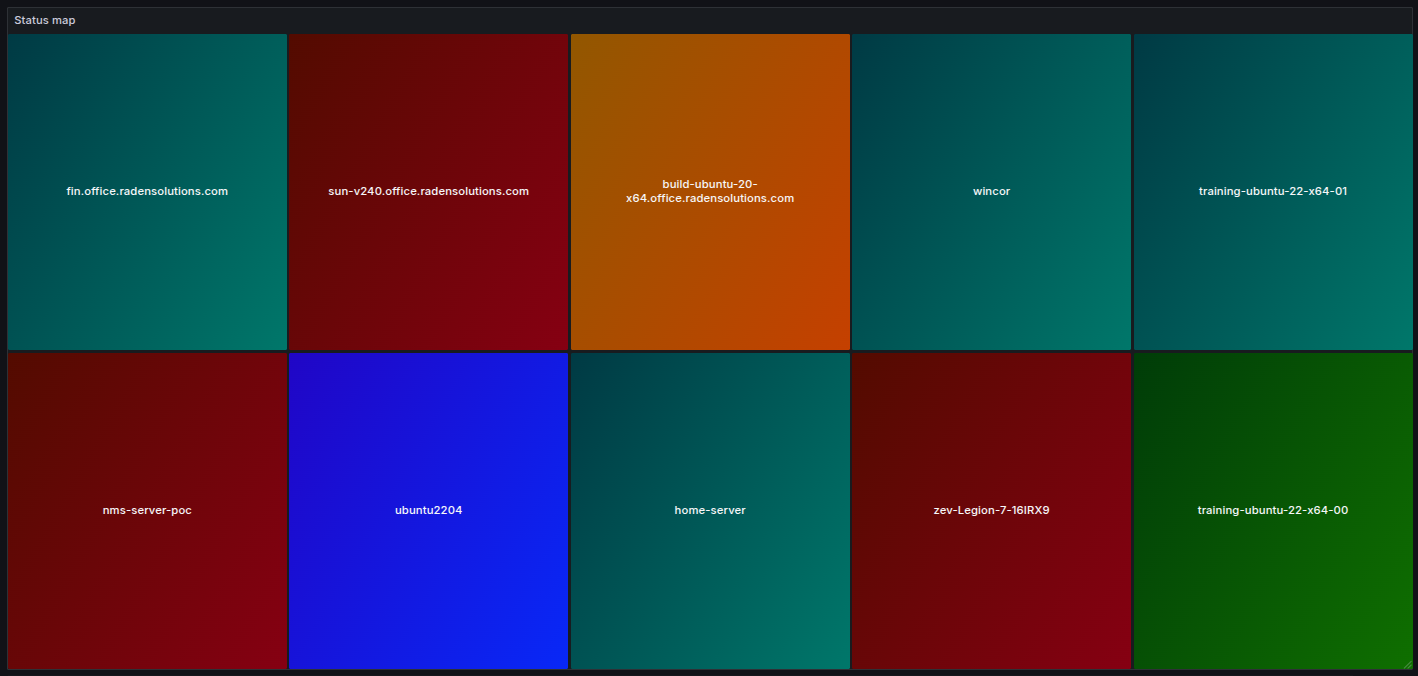
- Object status map
- Support for custom queries and dynamic dashboards
- Secure API key authentication
Requirements
- Grafana 12.4.0 or later
- NetXMS server 7.0.0 or later with WebAPI enabled
Getting Started
NetXMS Server Configuration
- Enable WebAPI on your NetXMS server by adding
Module=webapitonetxmsd.conf - Restart the NetXMS server
- Note: WebAPI uses unencrypted HTTP by default. Consider using nginx, reproxy, traefik, or another SSL offloading solution
- In the User Management view, select the user for Grafana and issue a new API key
Grafana Configuration
- Navigate to Configuration > Data Sources
- Add "NetXMS" as a new data source
- Configure the following:
- API address: base URL of the NetXMS web API, without a path (e.g.,
http://localhost:8000) - API Key: Your NetXMS API key issued in the previous step
- API address: base URL of the NetXMS web API, without a path (e.g.,
Usage
- Create a new dashboard and add a panel
- Select the NetXMS data source
- Choose the query type (alarms, DCI values, summary tables, etc.)
- Configure query parameters as needed
- Visualize your network data in real time
Screenshots


Documentation
Support
Grafana Cloud
Connect any plugin in Grafana Cloud.
- 150+ data source integrations
- Grafana Assistant - AI that correlates your data, builds queries, and answers questions
- 10k Prometheus metrics + 50 GB logs, traces, and profiles on the free tier
- ...and more
Insights
- Adoption
Running on 88 active Grafana instances.
- Activity
Last updated 27 Oct 2026.
1 release in the past year.
- Queries
0 total queries served across all Grafana Cloud instances.
- Version
- 2.1.1
- Dependencies
- Grafana >=12.4.0
- Developer
- Raden Solutions
Grafana Cloud
Connect any plugin in Grafana Cloud.
- 150+ data source integrations
- Grafana Assistant - AI that correlates your data, builds queries, and answers questions
- 10k Prometheus metrics + 50 GB logs, traces, and profiles on the free tier
- ...and more