
k6 browser check
k6 browser checks run a k6 script using the browser module to control a headless browser. Browser checks monitor web performance and can be used to continuously monitor critical user journeys and workflows.
With k6 browser checks, you can:
- Perform interactions on a web page like navigation, tap/click, filling forms, and scrolling.
- Leverage a Playwright-inspired API for authoring tests.
- Simultaneously make requests at the protocol-level as well as in the browser, to simulate user behavior and rich interactive scenarios.
- Set the window size to test mobile, tablet, and desktop views.
How it works
A k6 check runs one iteration of a k6 test at short, frequent intervals to proactively monitor applications and services.
Synthetic Monitoring results are stored as Prometheus metrics and Loki logs, which allow you to set up Grafana alerts for custom notifications and incident management.
The k6 scripts in Synthetic Monitoring are broadly compatible with other k6 products, like the k6 CLI and Grafana Cloud Performance Testing. This allows you to reuse the same k6 script for various use cases, enhancing testing productivity and coverage.
Create a k6 browser check
You can write and execute a k6 script from the code editor in the Synthetics UI.
- On the main menu, select Testing & synthetics and then Synthetics.
- Click Create new check or Add new check.
- Choose k6 browser as your check type.
- Set the value for the required options.
- Edit or copy your k6 script under Script.
- Schedule or run the check.
- Click Save to schedule the check.
- Click Test to run the k6 script.
For development and debugging, you can write and execute the k6 script from your local machine using the k6 CLI and your IDE. After completing the k6 script, create a new browser check or update the script of an existing one.
The Synthetics script editor includes a few scripts with basic examples. To get started implementing your first k6 browser tests, refer to the Create a k6 browser check tutorial.
Options
The list of common options to all check types:
Additionally, k6 scripted checks have the following options:
Required k6 imports and options
In order to run a browser check, the script must:
- Import the browser module
- Include the browser type “chromium” in the k6 options block.
import { browser } from 'k6/browser';

export const options = {
  scenarios: {
    ui: {
      options: {
        browser: {
          type: 'chromium',
        },
      },
    },
  },
};
Supported k6 Options
k6 options can be used to configure a wide range of features when running the k6 script. In Synthetic Monitoring, k6 options can only be set in the script options object:
export const options = {
  tags: { foo: 'bar' },
  userAgent: 'MyK6UserAgentString/1.0',
};
Several k6 options don’t apply in the context of Synthetic Monitoring. Here is the list of supported options:
Metrics
Synthetic checks store their results as Prometheus metrics, including the list of common metrics to all check types:
k6 metrics
Browser checks also collect the metrics produced by k6 and store them as Prometheus metrics.
k6 has two types of metrics:
- Built-in metrics: These are metrics collected by every k6 test, such as data received and total number of requests. In addition, browser checks collect Web Vitals metrics.
- Custom metrics: These are metrics that you can create in your test script to measure anything specific to your system or business logic. In Prometheus, they’re renamed to
probe_K6_METRIC_NAMEand mapped to Prometheus gauges.
k6 built-in metrics for browser checks are transformed in Synthetic Monitoring as follows:
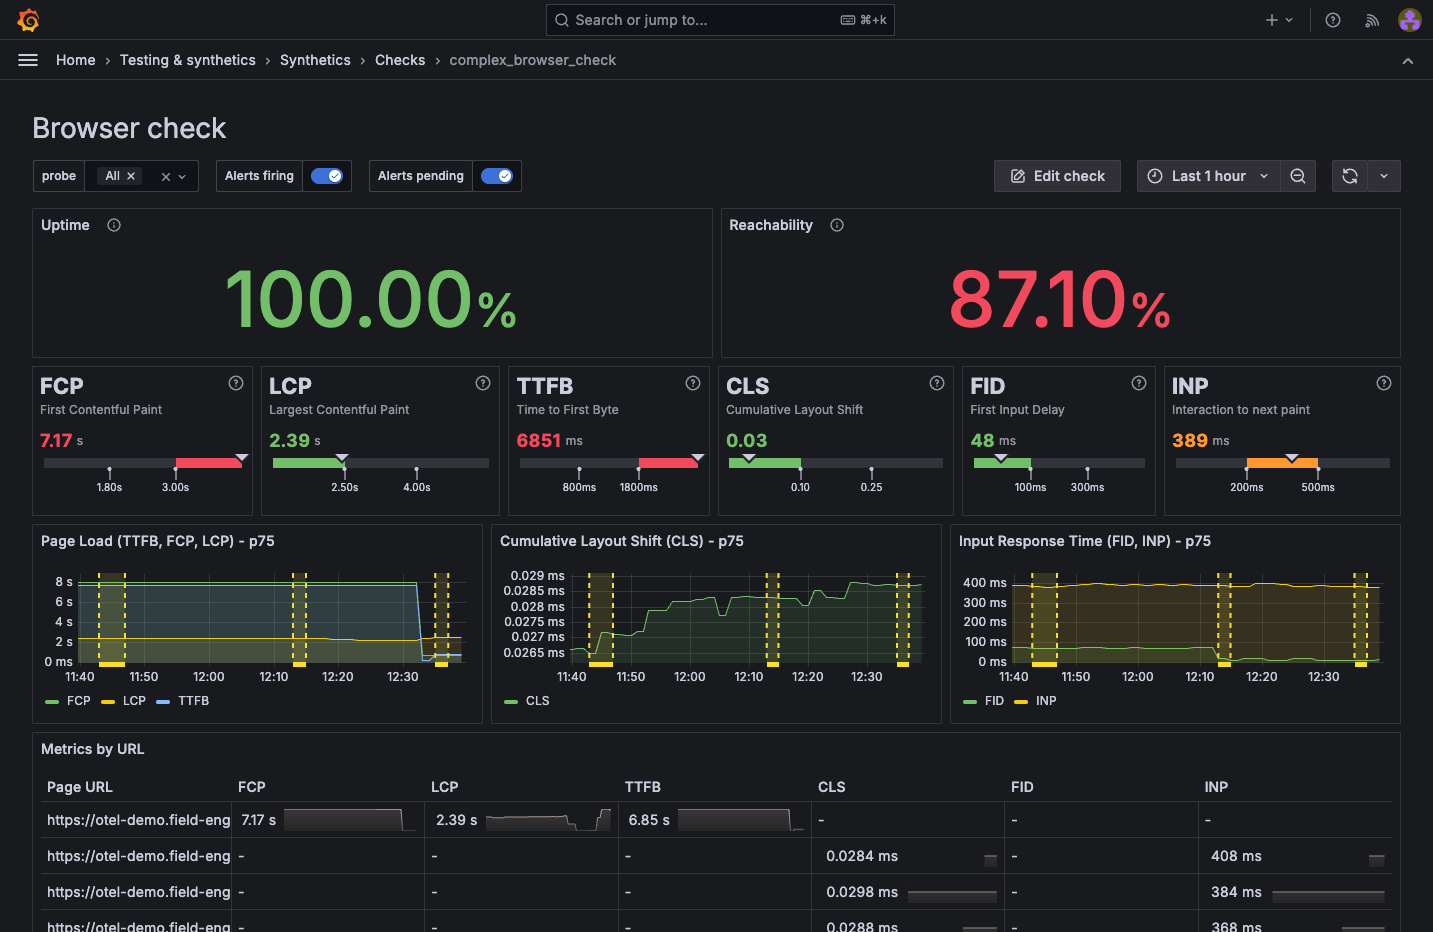
Visualization
You can query all the produced check metrics with Grafana Explore, where you can create custom panels and add them to your dashboards.
Additionally, each check includes a dashboard displaying the results of the most relevant metrics. To learn more about the various visualization options, refer to Analyze results.
Compatibility
Grafana Cloud Synthetic Monitoring has the following limitations for k6 scripts, compared to running them locally or using Grafana Cloud k6:
Workload options
Each k6 check runs only one iteration of the test. The system ignores options such as vus, duration, stages, and iterations.
Timeout
k6 checks have a maximum execution time. Configure this limit with the Timeout option in the UI.
k6 CLI
You can’t use the k6 CLI to run or upload k6 scripts to Grafana Cloud Synthetic Monitoring.
Other k6 APIs
Thresholds aren’t supported.
Labels
Custom labels that you define in the UI aren’t included in k6 metrics. Non-k6 metrics don’t include labels that you define in the k6 tags option.
Load local files
For security reasons, probes can’t load local files. k6 APIs such as open, fs, and grpc.load (non-reflection) aren’t supported.
To import local modules or libraries, use a bundler to build your k6 script with its dependencies locally. However, note that bundled scripts have additional limitations for browser checks.
Limitations
Bundled or minified scripts
The Synthetic Monitoring UI validates scripts by checking for required imports and options. This validation fails with webpack-compiled, bundled, or minified scripts because the code structure is obfuscated.
To create browser checks with bundled scripts, use Terraform or the Synthetic Monitoring API.
Public probe memory
Browsers on public probes are allocated 1GB of RAM when running tests, which may be insufficient for large web pages. If a page is too large to load, the test execution fails and logs the message: Unexpected DevTools server error: Target has crashed.


