
Understand MongoDB dashboards
The MongoDB integration provides three pre-built dashboards that you can use immediately to begin monitoring and troubleshooting database performance issues. In this step of the journey, you’ll become familiar with these pre-built dashboards and learn how to use them to address various problems.
While this journey focuses on configuring the MongoDB integration for one instance, the following dashboard images show the kinds of data you’ll see when you monitor multiple MongoDB instances across your infrastructure.
Did you know?
If you don’t see any metrics, try switching the data source using the drop-down at the top of the dashboard.
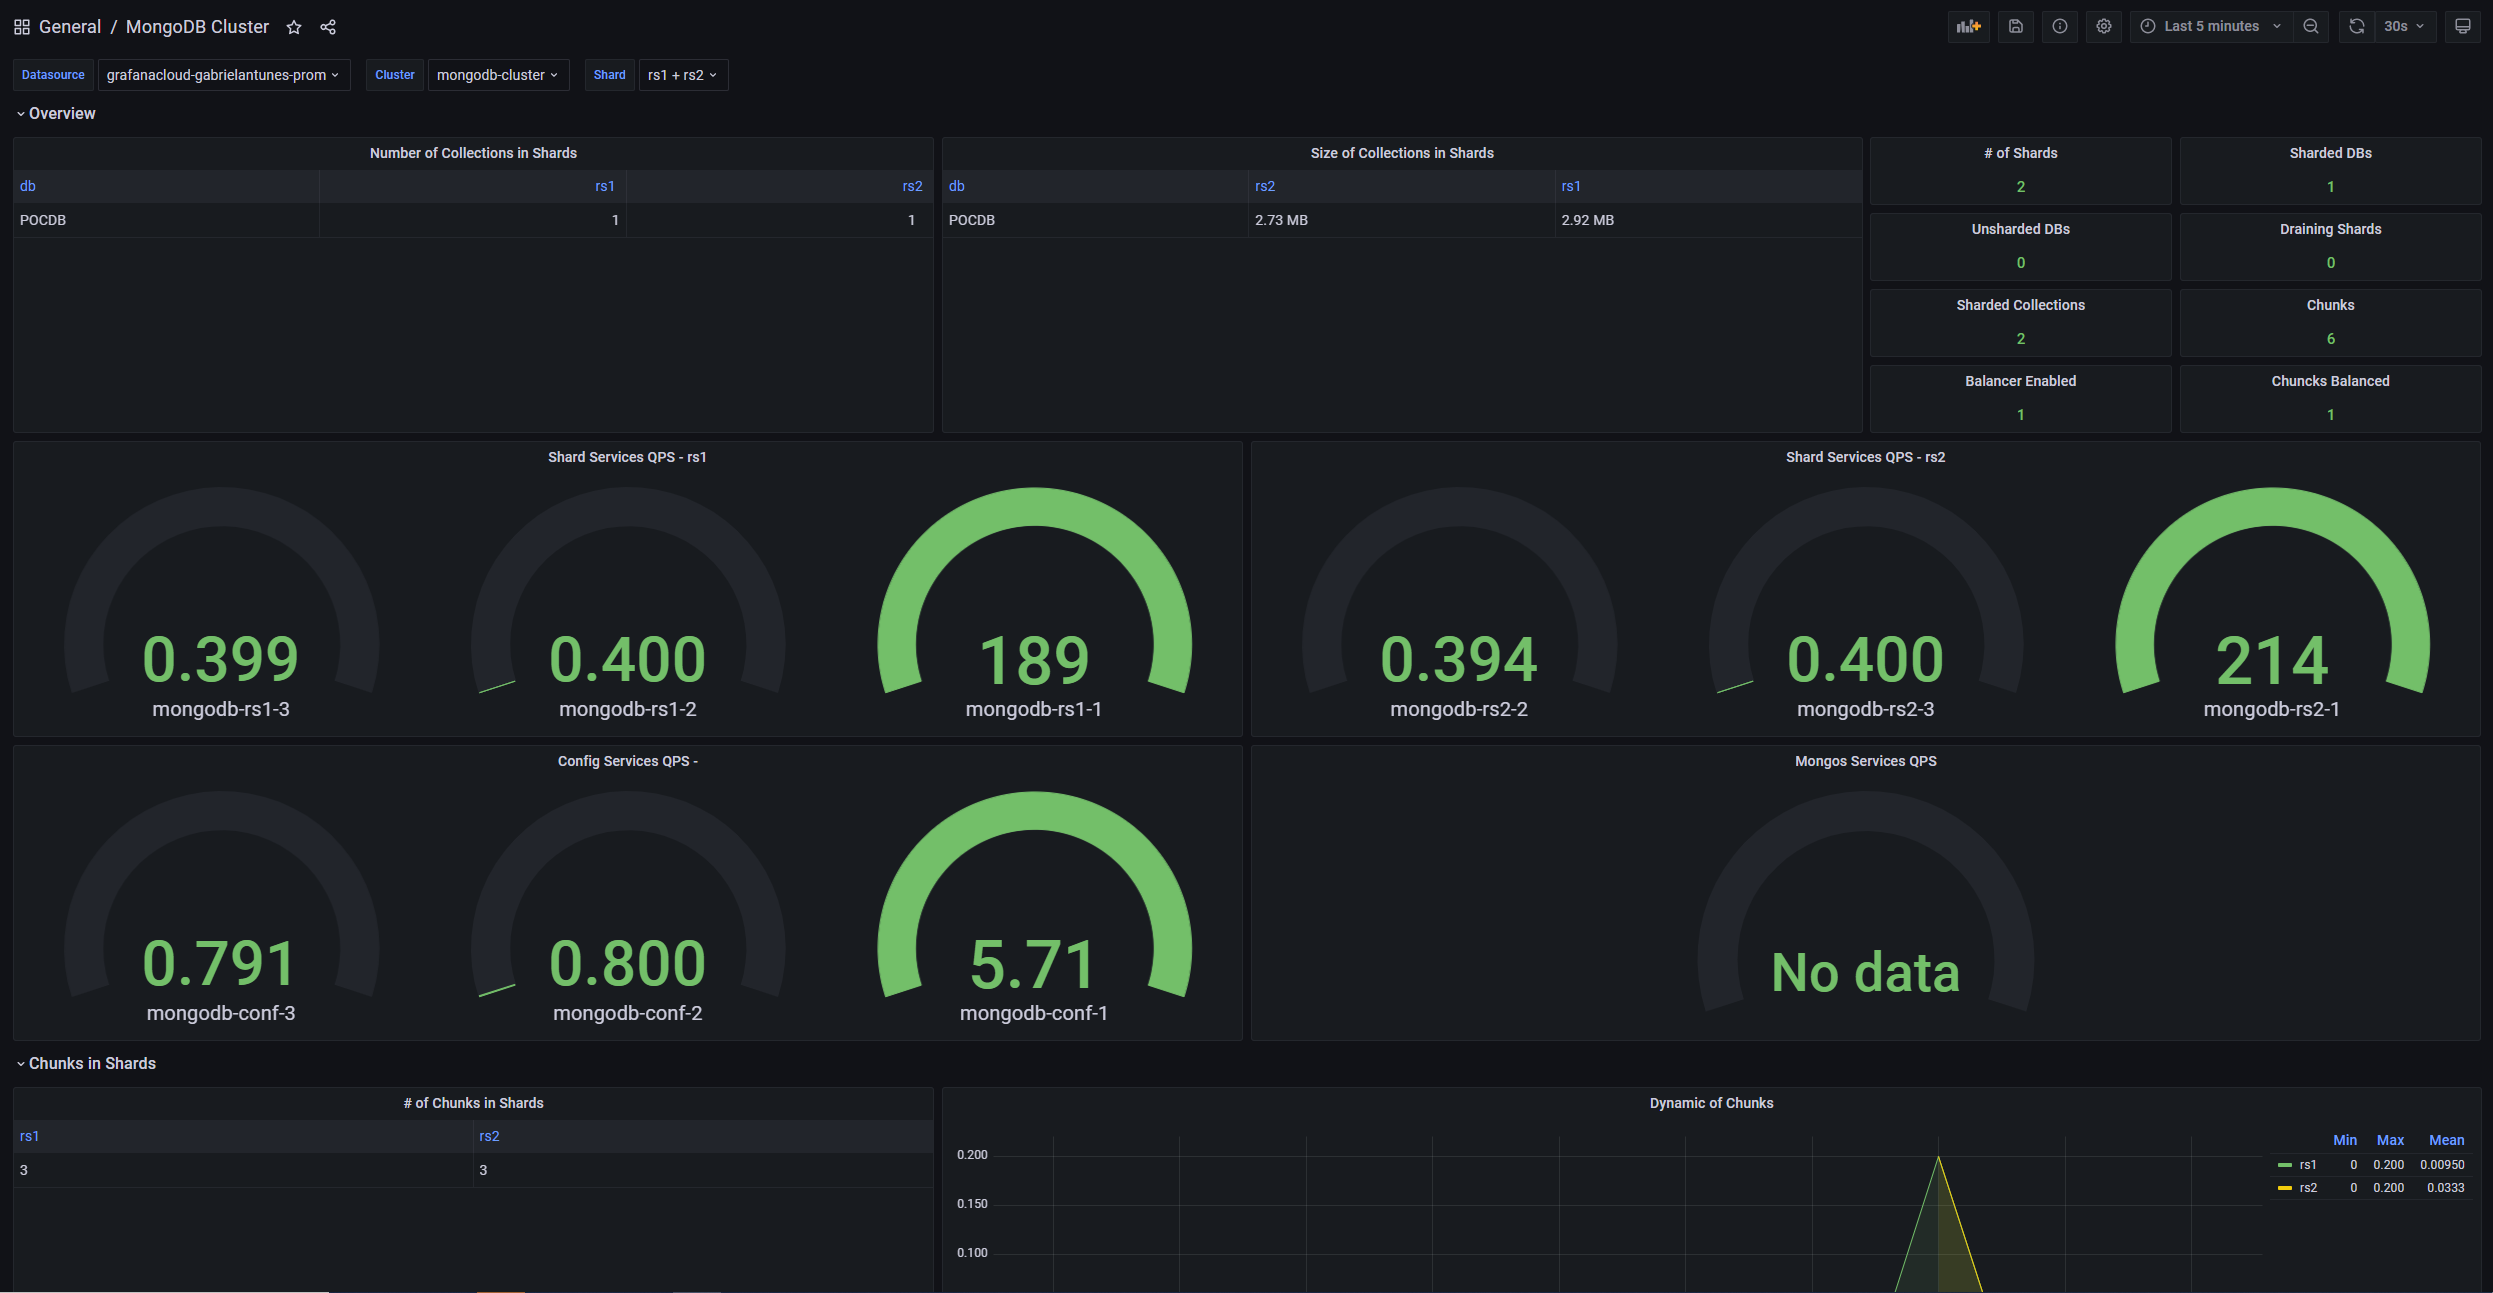
This dashboard provides a comprehensive view of your MongoDB cluster performance and health, including:
- Cluster-wide metrics: Overall cluster performance indicators and health status
- Cross-node comparison: Performance metrics across different MongoDB nodes
- Resource utilization: Cluster-level resource consumption and capacity planning
- Sharding statistics: Information about data distribution and shard performance
Use this dashboard to:
- Monitor overall cluster health and performance trends
- Compare performance across different nodes in your cluster
- Identify capacity planning needs and resource bottlenecks
- Track sharding efficiency and data distribution
This dashboard offers detailed insights into individual MongoDB instance performance, including:
- Instance status: Displays whether MongoDB is running and reachable
- Connection statistics: Shows current active connections and available connection capacity
- Operation rates: Displays operations per second by type (insert, query, update, delete)
- Memory utilization: Shows current memory usage patterns and trends
- Storage metrics: Indicates database and index size information
Use this dashboard to:
- Monitor individual instance health and performance
- Track connection usage and identify potential connection issues
- Analyze operation patterns and query performance
- Monitor memory and storage utilization for capacity planning

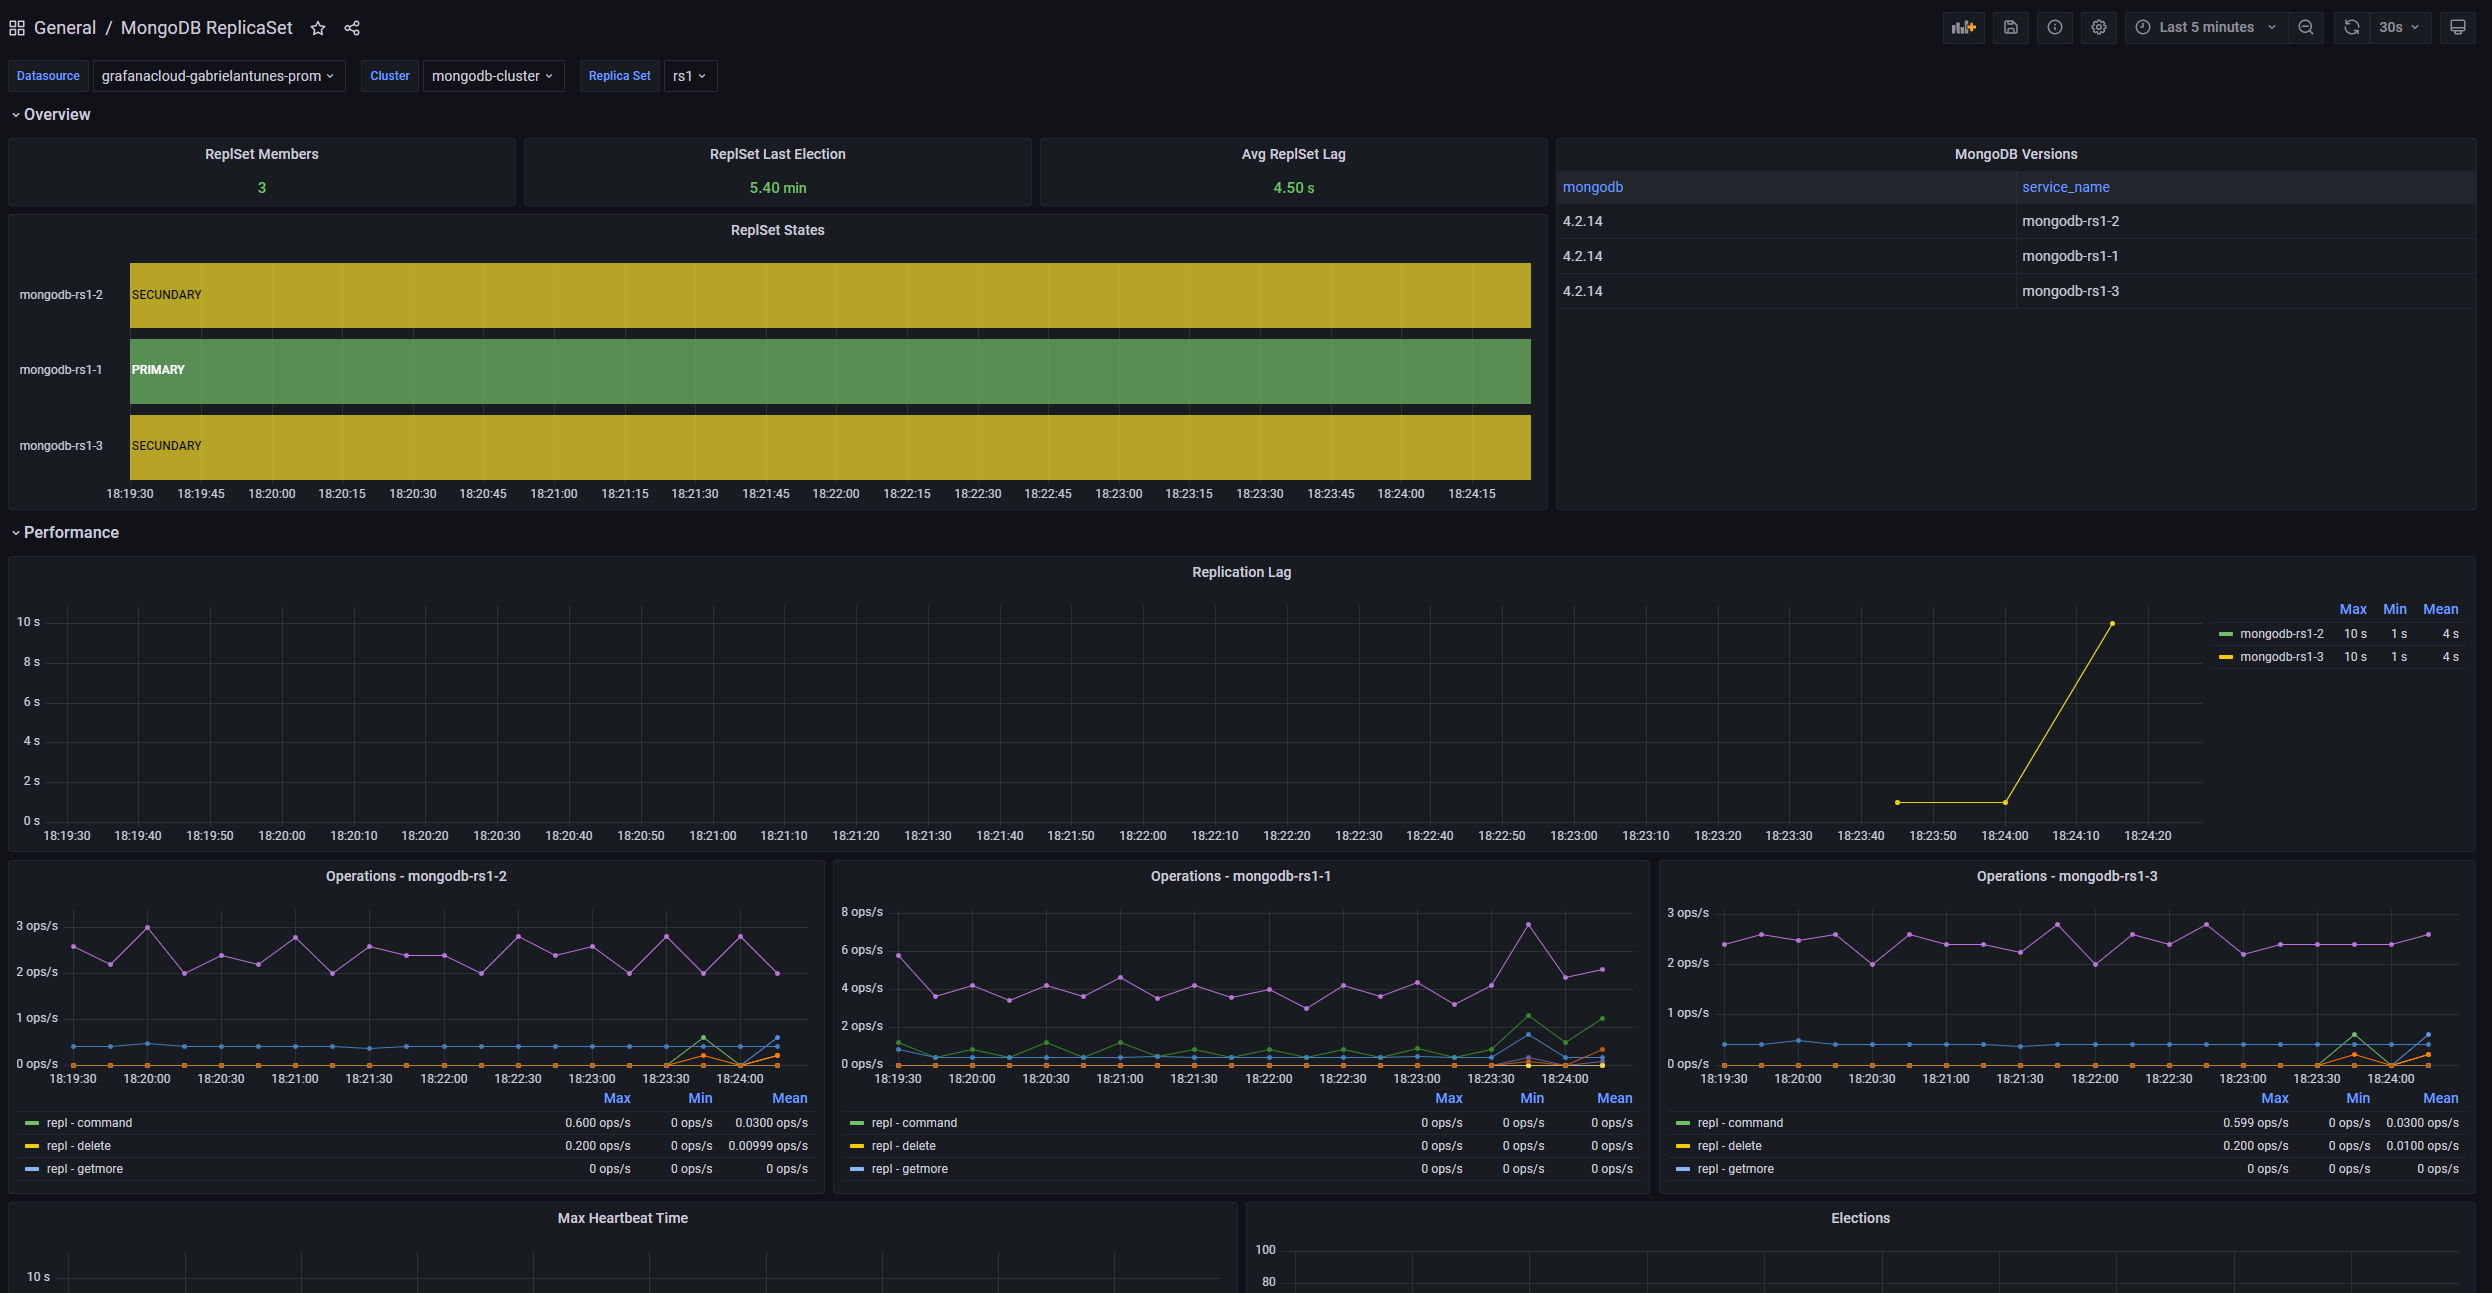
This dashboard provides comprehensive monitoring of MongoDB replica set health and replication performance, including:
- Replica member status: Health status of all replica set members
- Replication lag: Delay between primary and secondary members
- Election metrics: Information about replica set elections and state changes
- Oplog statistics: Oplog size and utilization for replication tracking
Use this dashboard to:
- Monitor replica set health and member availability
- Track replication performance and identify lag issues
- Plan for failover scenarios and election patterns
- Ensure data consistency across replica set members
In your final milestone, you’ll complete the MongoDB monitoring journey.
Please tell us what didn't work:
At this point in your journey, you can explore the following paths: