
Plugins 〉Cube
Cube


Cube Datasource Plugin for Grafana

Experimental: This plugin is experimental. Features may be incomplete or have known limitations, and you should expect some rough edges. See Experimental Status for details.
Connect Grafana to Cube for semantic layer analytics. Query measures and dimensions, apply filters, and visualize your data—without writing SQL.
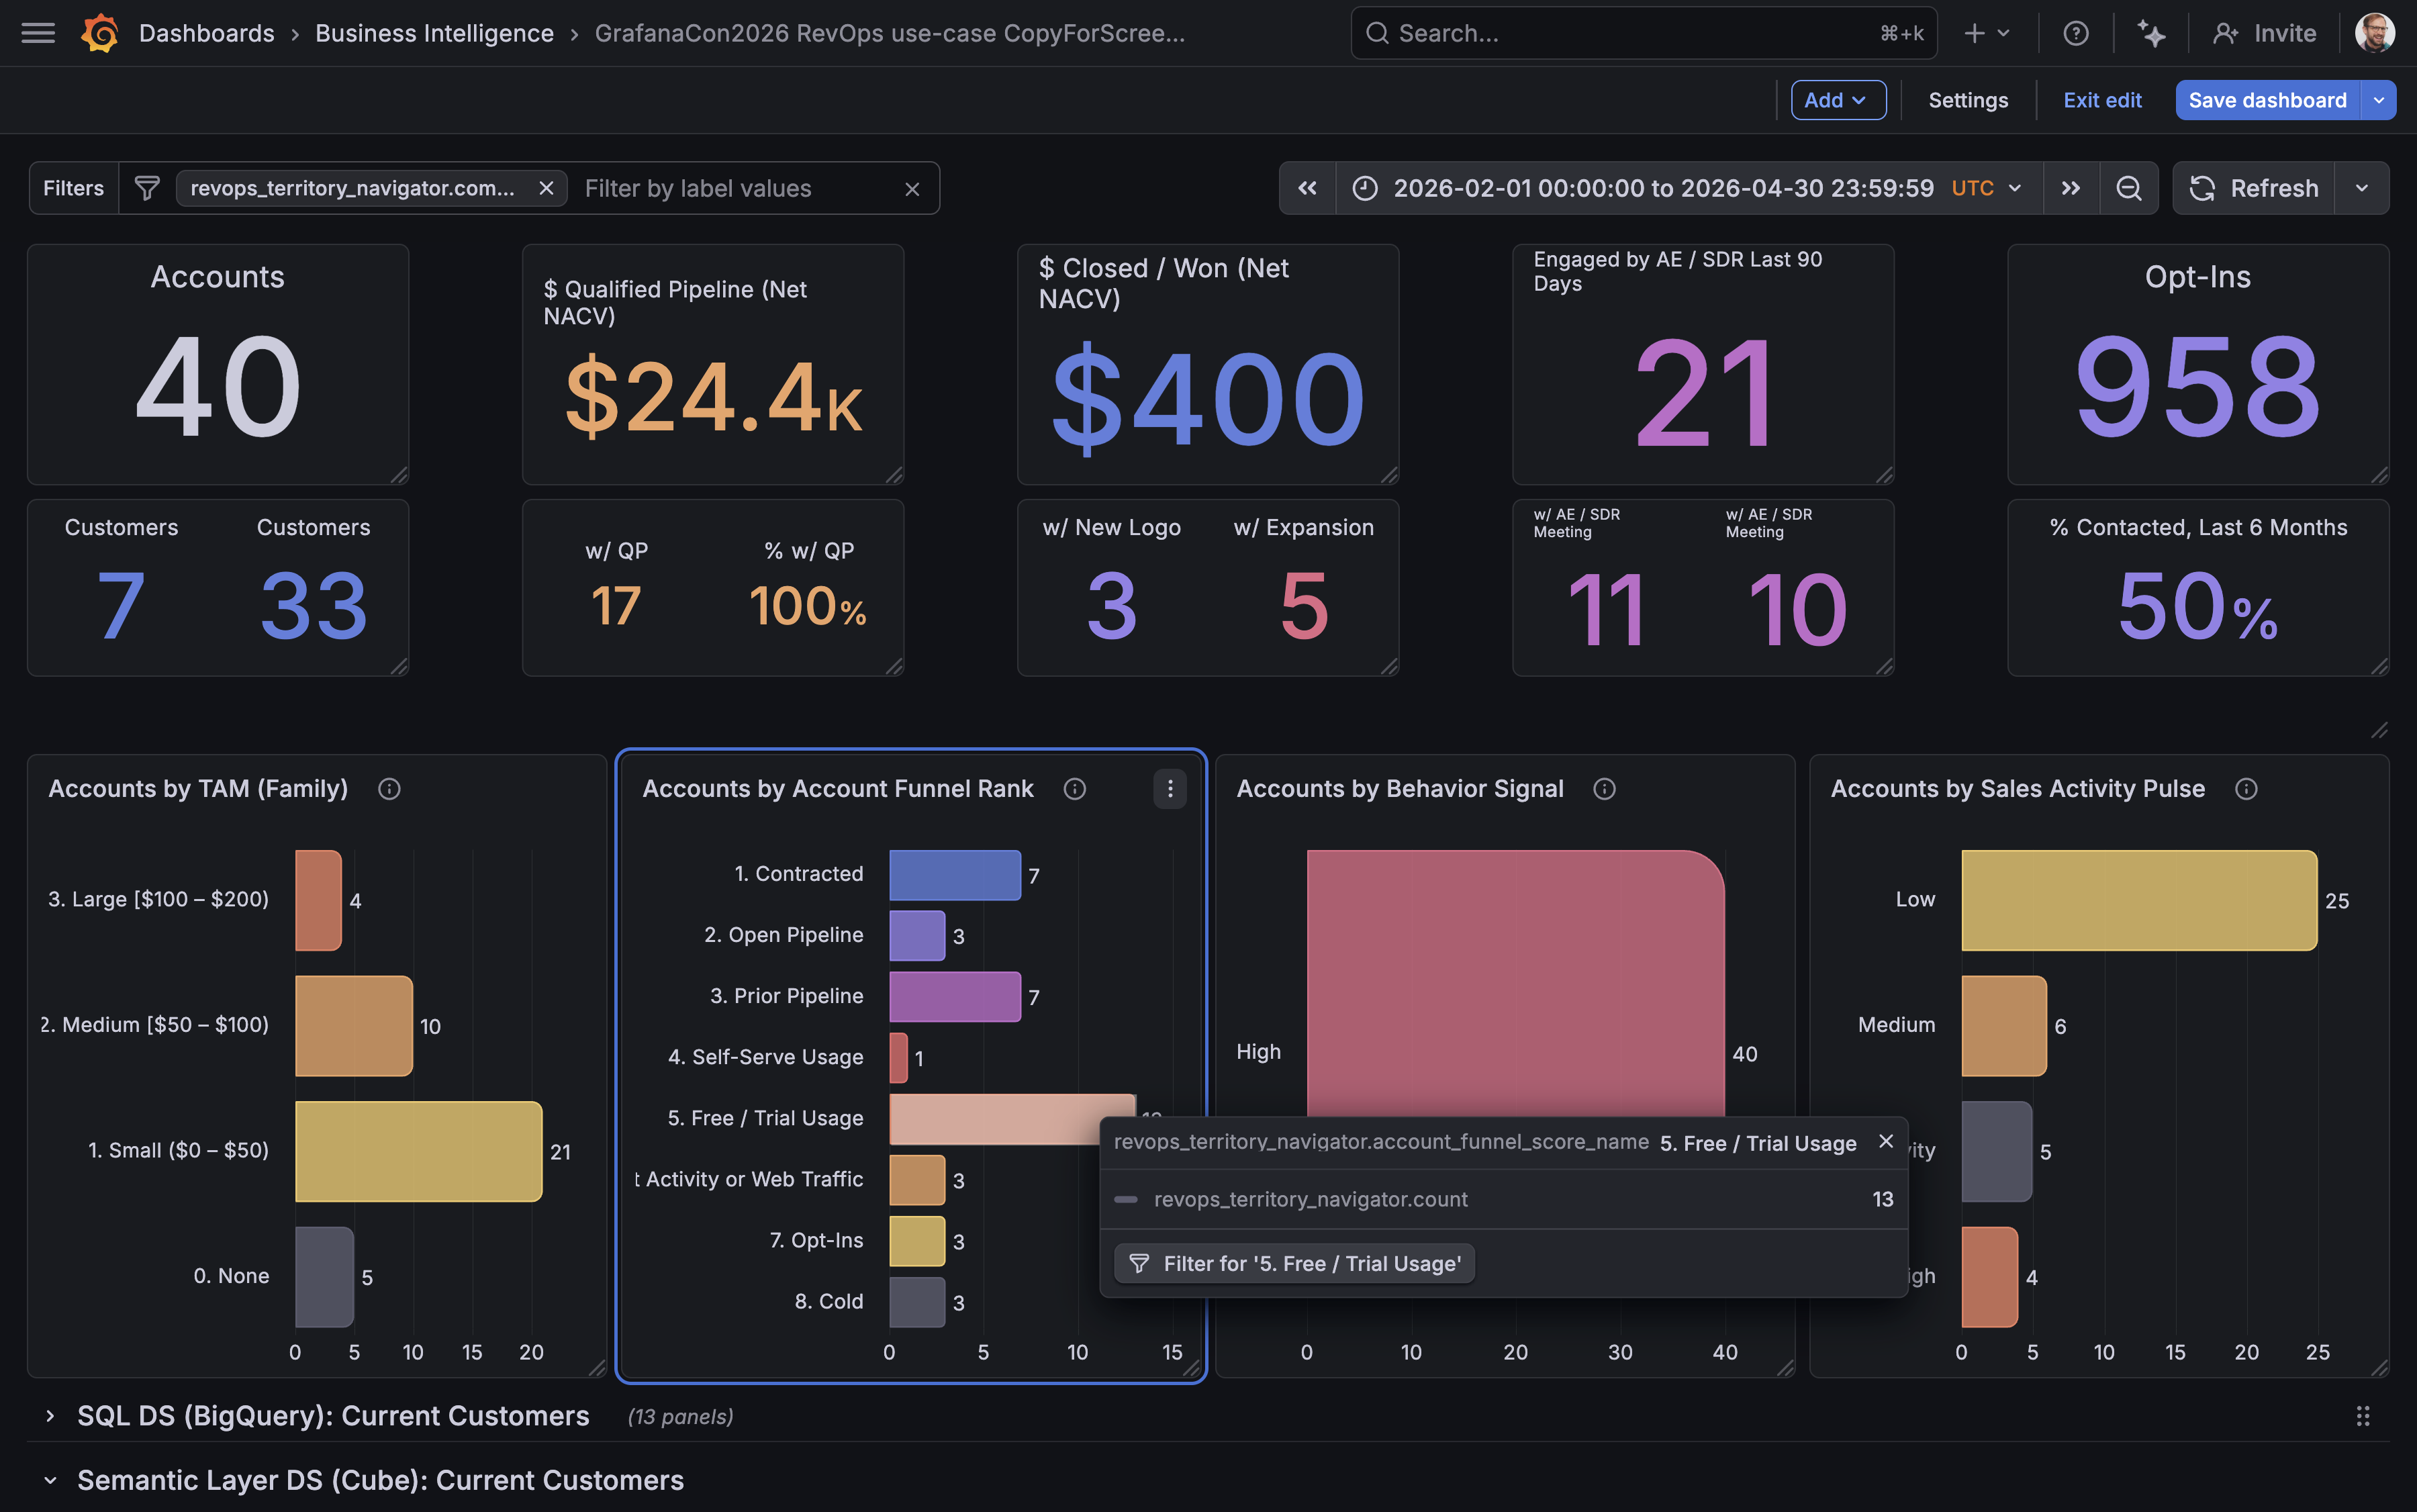
Try it live on play.grafana.org →
Why Use This Plugin?
This plugin brings a true semantic layer to Grafana for the first time. By connecting to Cube, you get:
- No more writing SQL — Query your data using pre-defined measures and dimensions
- No more writing JOINs — Cube handles the complexity of joining tables for you
- Single source of truth — Business metrics are defined once in Cube and used consistently across all dashboards
- Lower barrier to entry — Non-technical users can build dashboards without SQL knowledge
- Scalable complexity — Start simple, but analytics queries can grow as sophisticated as you need
- More maintainable dashboards — Panels require far less code when using semantic definitions
- Cross-panel filtering — Use AdHoc filters to drill down across Table and Bar Chart panels, enabling data exploration for dashboard viewers
Features
Query Builder
The visual query builder supports:
| Feature | Description |
|---|---|
| Dimensions | Select one or more dimensions to group your data |
| Measures | Select one or more measures to aggregate |
| Limit | Control the number of rows returned (defaults to 10,000; maximum 50,000). See Cube's row limit documentation for details. |
| Filters | Filter your query before aggregation |
| Order | Sort results by any selected dimension or measure |

Filtering
The visual query builder supports:
- Filter members: Dimensions only
- Operators:
equalsandnotEquals, each accepting multiple values - Multiple filters: Combine with AND (intersection)
Advanced Filtering (via Panel JSON)
The full Cube filter syntax is supported when editing queries via the panel JSON editor, including:
- All Cube filter operators:
contains,gt,gte,lt,lte,set,notSet,inDateRange, and more - Measure filters: Filter on any measure, not just dimensions
- AND/OR filter groups: Combine filters with logical AND/OR for complex conditions (e.g. "status = completed OR payment_method = credit_card")
Queries using these features display in the read-only JSON viewer (see below). The visual builder includes a hint with a link to the Cube filter docs for reference.
JSON Query Viewer
When a query uses features that the visual builder cannot represent (such as time dimensions configured in the panel JSON), the editor automatically switches to a read-only JSON viewer. This shows:
- An info banner explaining which features triggered JSON mode
- The full query as syntax-highlighted JSON
- A compiled SQL preview
This ensures no query configuration is hidden — users always see exactly what is configured, even for advanced queries. To edit these queries, use the dashboard JSON editor or panel JSON editor.
Dashboard Variables
AdHoc Filters
Clicking a value in a Table or Bar Chart panel creates or updates an AdHoc dashboard variable scoped to the Cube datasource. This enables powerful cross-panel filtering and data exploration.
AdHoc filters can also be edited directly in the dashboard UI to add additional filter members, operators, and values. The same operator limitations apply (= and != only).
How filters combine:
- Multiple AdHoc filters combine with AND (intersection)
- AdHoc filters combine with per-panel filters using AND (intersection)
Time Range Filtering
To filter all panels by the dashboard time picker:
- Create a dashboard variable with identifier
cubeTimeDimension - Set its value to the time dimension field you want to filter by (e.g.,
order_date) - The dashboard's
$__fromand$__tovariables will automatically apply to all panels
Requirements
- Grafana 12.2.5 or later
- A running Cube instance (self-hosted*)
*See Known Limitations regarding using Cube Cloud.
Getting Started
- Install the plugin from the Grafana plugin catalog
- Go to Connections → Data sources → Add data source
- Search for "Cube" and select it
- Configure the connection:
- URL: Your Cube REST API endpoint (e.g.,
http://localhost:4000) - Deployment Type: Select your Cube deployment type (self-hosted or self-hosted-dev)*
- API Secret: Your Cube API secret (if authentication is enabled)
- SQL Datasource: Select the SQL datasource to open when clicking "Edit SQL in Explore"
- URL: Your Cube REST API endpoint (e.g.,
- Click Save & test to verify the connection
*See Known Limitations regarding using Cube Cloud.
Known Limitations
This plugin is experimental. Current limitations include:
| Limitation | Details |
|---|---|
| Cube Cloud authentication | Authentication does not yet work with Cube Cloud. Self-hosted Cube (dev and production mode) works correctly. |
| Technical field names | Dimension and measure names currently use full technical identifiers (e.g., orders.customer_name) rather than human-readable labels. This is due to a dependency on how Grafana implements AdHoc filters. |
| Visual builder filter operators | The visual builder only supports equals and notEquals. All Cube operators are available via panel JSON. |
| Visual builder filter members | The visual builder only supports dimension filters. Measure filters are available via panel JSON. |
| Cross-panel filtering | Depends on Grafana AdHoc filters. Currently works with Table and Bar Chart panels only |
Experimental Status
Not for production use. This plugin is experimental and is not meant to be used in production or critical environments.
This plugin is marked as experimental, meaning:
- Features may be incomplete or have known limitations
- Backward compatibility is not guaranteed between versions
- The data model, configuration, or UI might change, potentially breaking dashboards
- The risks are unknown and potentially high
- Support is limited to GitHub issues; no SLA is provided
Do not use this plugin in production environments. It is intended for:
- Testing and evaluation
- Development environments
- Providing early feedback
- Validating use cases before production readiness
Track the changelog for breaking changes and stability updates.
Documentation
Contributing
We welcome contributions and feedback! Please open issues or pull requests on the GitHub repository.
Grafana Cloud Free
- Free tier: Limited to 3 users
- Paid plans: $55 / user / month above included usage
- Access to all Enterprise Plugins
- Fully managed service (not available to self-manage)
Self-hosted Grafana Enterprise
- Access to all Enterprise plugins
- All Grafana Enterprise features
- Self-manage on your own infrastructure
Installing Cube on Grafana Cloud:
Installing plugins on a Grafana Cloud instance is a one-click install; same with updates. Cool, right?
Note that it could take up to 1 minute to see the plugin show up in your Grafana.
Warning
Plugin installation from this page will be removed in February 2026. Use the Plugin Catalog in your Grafana instance instead. Refer to Install a plugin in the Grafana documentation for more information.
Installing plugins on a Grafana Cloud instance is a one-click install; same with updates. Cool, right?
Note that it could take up to 1 minute to see the plugin show up in your Grafana.
Installing plugins on a Grafana Cloud instance is a one-click install; same with updates. Cool, right?
Note that it could take up to 1 minute to see the plugin show up in your Grafana.
Warning
Plugin installation from this page will be removed in February 2026. Use the Plugin Catalog in your Grafana instance instead. Refer to Install a plugin in the Grafana documentation for more information.
Installing plugins on a Grafana Cloud instance is a one-click install; same with updates. Cool, right?
Note that it could take up to 1 minute to see the plugin show up in your Grafana.
For more information, visit the docs on plugin installation.
Installing on a local Grafana:
For local instances, plugins are installed and updated via a simple CLI command. Plugins are not updated automatically, however you will be notified when updates are available right within your Grafana.
1. Install the Data Source
Use the grafana-cli tool to install Cube from the commandline:
grafana-cli plugins install The plugin will be installed into your grafana plugins directory; the default is /var/lib/grafana/plugins. More information on the cli tool.
Alternatively, you can manually download the .zip file for your architecture below and unpack it into your grafana plugins directory.
Alternatively, you can manually download the .zip file and unpack it into your grafana plugins directory.
2. Configure the Data Source
Accessed from the Grafana main menu, newly installed data sources can be added immediately within the Data Sources section.
Next, click the Add data source button in the upper right. The data source will be available for selection in the Type select box.
To see a list of installed data sources, click the Plugins item in the main menu. Both core data sources and installed data sources will appear.
Changelog
0.3.3 (2026-03-20)
Bug Fixes
- Fix release build: Remove Go source files shipped inside the
flattednpm package (golang/pkg/flatted/flatted.go) via apostinstallscript, preventing the Grafana plugin validator from rejecting the archive with "Invalid Go manifest file" (#2700)
Full Changelog: v0.3.2...v0.3.3
0.3.2 (2026-03-20)
Security
- Backend authorization for generate-schema: The mutating
generate-schemaCallResource route now requires Admin org role, preventing non-admin users from triggering model file generation on the upstream Cube instance (#216) - Dependency security fixes: Update
flattedto 3.4.2 to resolve CVE-2026-32141 and CVE-2026-33228
Improved
- Standard SQL casts: Replace PostgreSQL-specific
::dateand::numericcast syntax with standardCAST()in demo dashboard queries and Cube model, improving compatibility with DuckDB and BigQuery (#204)
Full Changelog: v0.3.0...v0.3.2
0.3.0 (2026-03-13)
Features
- Standard datasource URL: Use Grafana's standard
urlfield for the Cube API endpoint instead ofjsonData.cubeApiUrl, with backward-compatible fallback (#177) - Generated data model dashboard: Added a provisioned demo dashboard for the generated data model (#175)
- Refreshed demo dashboards: Updated provisioned demo dashboards to reflect current plugin capabilities (#184)
Bug Fixes
- Stale SQL preview: SQL preview now refreshes when dashboard variables change (#150)
Deprecated
jsonData.cubeApiUrlprovisioning field: The URL should now be set using Grafana's standard top-levelurlfield. The legacyjsonData.cubeApiUrlfield continues to work as a fallback but will be removed in a future release.Migrate provisioning configs:
  datasources:
    - name: Cube
      type: grafana-cube-datasource
+     url: http://localhost:4000
      jsonData:
-       cubeApiUrl: http://localhost:4000
+       # cubeApiUrl is no longer needed for the URL
Full Changelog: v0.2.0...v0.3.0
0.2.0 (2026-02-18)
Features
- Data Model config page: Full config page for generating Cube data model YAML files from connected database schemas (#132)
- JSON query viewer: When a query contains features the visual editor cannot represent (e.g. time dimensions), the query editor switches to a read-only JSON viewer with syntax highlighting and a compiled SQL preview (#136)
- All Cube filter operators: Support all Cube filter operators (
contains,gt,gte,lt,lte,set,notSet,inDateRange, and more) and measure filters via panel JSON (#138) - AND/OR filter groups: Support logical AND/OR filter groups for complex conditions via panel JSON (#139)
- Template variable detection in filters: Filter values containing template variables automatically trigger the JSON viewer to avoid corrupting the variable syntax (#140)
- No-cubes guidance: When no cubes are detected, the query editor guides users to the Data Model configuration tab (#148)
Bug Fixes
- Preserve limit zero and legacy template vars: Correctly handle
limit: 0(unlimited) and detect legacy$variabletemplate variable syntax (#143)
Full Changelog: v0.1.4...v0.2.0
0.1.4 (2026-02-13)
Changed in 0.1.4
- Set minimum supported Grafana version to
12.2.5based on patched Grafana plugin backward-compatibility support for jsx-runtime externalization. - Drop support for Grafana versions earlier than
12.2.5. - Use
12.3.3as the default local development target while keeping12.2.5as the minimum supported version.
0.1.3 (2026-02-12)
Fixed in 0.1.3
- Externalize
react/jsx-runtimeandreact/jsx-dev-runtimeto keep frontend bundle behavior compatible with React 19 - Remove invalid alerting receiver from local provisioning to unblock React 19 preview startup during validation
Changed in 0.1.3
- Upgrade shared
plugin-ci-workflowstov6.0.0so React 19 preview checks are included in CI by default
0.1.2 (2026-02-12)
Fixed in 0.1.2
- Handle Cube "Continue wait" polling protocol correctly for long-running queries
- Update non-major dependencies, including security-related updates
Changed in 0.1.2
- Simplify backend test interaction patterns for better maintainability
Documentation in 0.1.2
- Add Cube SDK parity guidance for backend protocol behavior
0.1.1 (2026-01-28)
Fixed
- Compressed query editor screenshot to resolve webpack asset size warning
- Updated release workflow to use Node 24, matching
package.jsonengine requirements
0.1.0 (2026-01-27)
Initial public release.
Features
- Query Builder: Visual interface for building Cube queries with dimensions, measures, and filters
- Order By: Configurable sorting for query results
- SQL Preview: View the generated SQL before executing queries
- Multi-value Filters: Filter operators support multiple values with intuitive multi-select UI
- Time-series Support: Compatible with Grafana time-series panels and time range filtering
- AdHoc Filters: Support for Grafana's ad-hoc filter variables
Notes
This is an experimental data source plugin. Breaking changes may occur in minor version updates until v1.0.0.