
How Hona scaled its legal-tech platform with open observability on Grafana Cloud
Hona is a legal-tech company based in Utah that helps law firms keep clients informed—without wasting attorney time on manual follow-ups. Its platform automates case notifications, reminders, documentation exchanges, and even inbound calls using voice AI.
For Matías Delgado, Staff Software Engineer and the sole Argentina-based member of Hona’s distributed DevOps team, growth created a new challenge: the team was moving from a monolithic app to a microservices architecture without the observability foundation needed to gain visibility into the system.
“Before Grafana Cloud, it was very hard for developers to understand what was happening inside the applications,” Delgado said. “As we grew, we had many interconnected services, making tracing issues difficult.”
As usage increased and new AI-powered workflows were introduced, the team needed an observability platform that was easier to use, aligned with open standards, and ready to scale.
The problem: Limited visibility and difficult tooling slowed development
Hona originally relied on Amazon CloudWatch for monitoring. The service worked fine when the company had one monolithic application, but as the team split functionality into microservices, the cracks showed quickly.
“Dashboards in CloudWatch were complicated and often didn’t reflect reality,” Delgado said. “Its query language is also hard to use, and not an industry standard.”
The consequences were real:
- Debugging took too long. Tracing issues across multiple services was tedious and error-prone.
- Dashboards weren’t trusted. Developers struggled to build or maintain visualizations in CloudWatch.
- Service ownership stalled. Many on the team had never used an observability tool before, and CloudWatch’s complexity discouraged adoption.
- SLOs were impossible. “SLA and SLO policies wouldn’t have been possible with our old tools,” Delgado said.
As the company added new AI-driven call routing, legal-lead triage, and automated client-notification workflows, the need for a consistent, easy-to-use observability platform became urgent.
Searching for a solution: Open standards and predictable costs
Hona evaluated several approaches: self-hosting Grafana OSS, using AWS’ managed Grafana option, or implementing Grafana Cloud. Datadog and similar vendors were briefly considered, but were deemed “too expensive,” Delgado noted.
The team’s criteria were clear:
- Open standards and open source roots so developers could rely on industry-standard tooling.
- A low-friction learning curve for a team new to observability.
- Easy scalability as more microservices are deployed.
- Predictable pricing versus the cost of running and maintaining their own stack.
- A unified place to see metrics, logs, and dashboards.
Delgado had used Grafana OSS before, and “strongly advocated” for bringing it into Hona. Ultimately, the team chose Grafana Cloud to eliminate the operational overhead of hosting and managing the software themselves.
“We considered self-hosting the open source version, but when we calculated the engineering time for setup and maintenance versus Grafana Cloud, Grafana Cloud made much more sense,” Delgado said.
Implementation: A gradual rollout and immediate developer adoption
Hona rolled out Grafana Cloud as its central observability platform for metrics and logs. To avoid disruption, the team ran CloudWatch and Grafana Cloud in parallel during the transition. Key steps included:
- Migrating metrics first. Developers kept using CloudWatch while all metrics also flowed into Grafana Cloud.
- Rebuilding key dashboards. Once the core Grafana dashboards were ready, teams were onboarded service by service.
- Introducing SLOs. “Once we had core dashboards and SLOs set up, adoption grew,” Delgado said.
- Powering better IRM. Alerts became easier to configure, and alarms became more meaningful.
- Enabling self-service. Hona created an internal script that generates a new microservice with Grafana Cloud connectivity built in. Any developer can spin up a new service and start capturing metrics and logs automatically.
Support from Grafana Labs played a big role in streamlining the process. When Hona hit a metrics spike during rollout, the response was instant. “That level of support was impressive,” Delgado noted.
For compliance reasons, the team still archives long-term logs in Amazon S3, but Grafana Cloud powers the last 30 days of logs and all active dashboards.
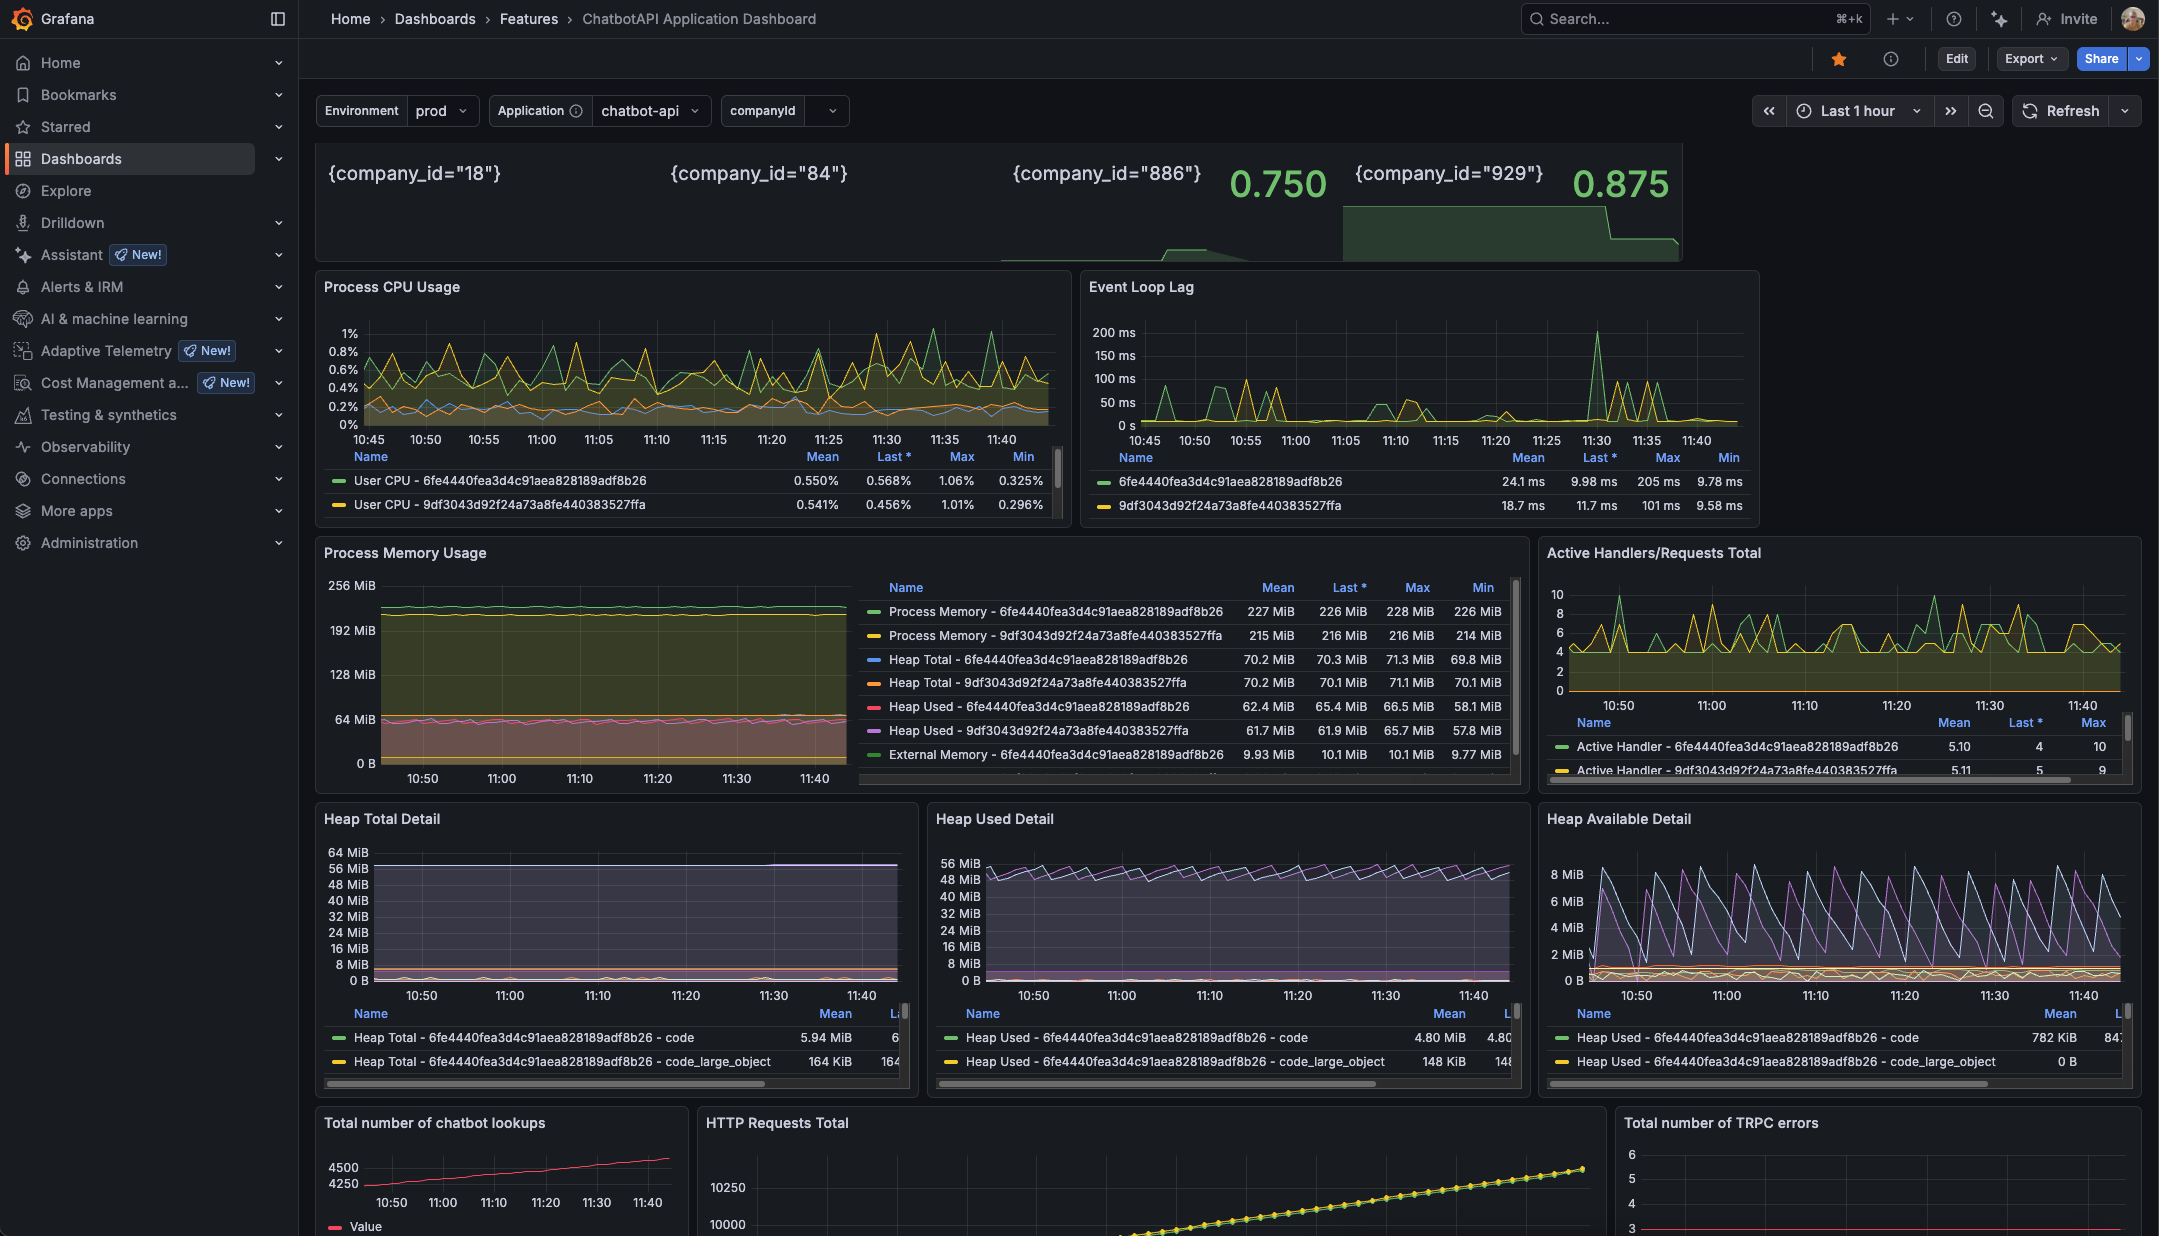
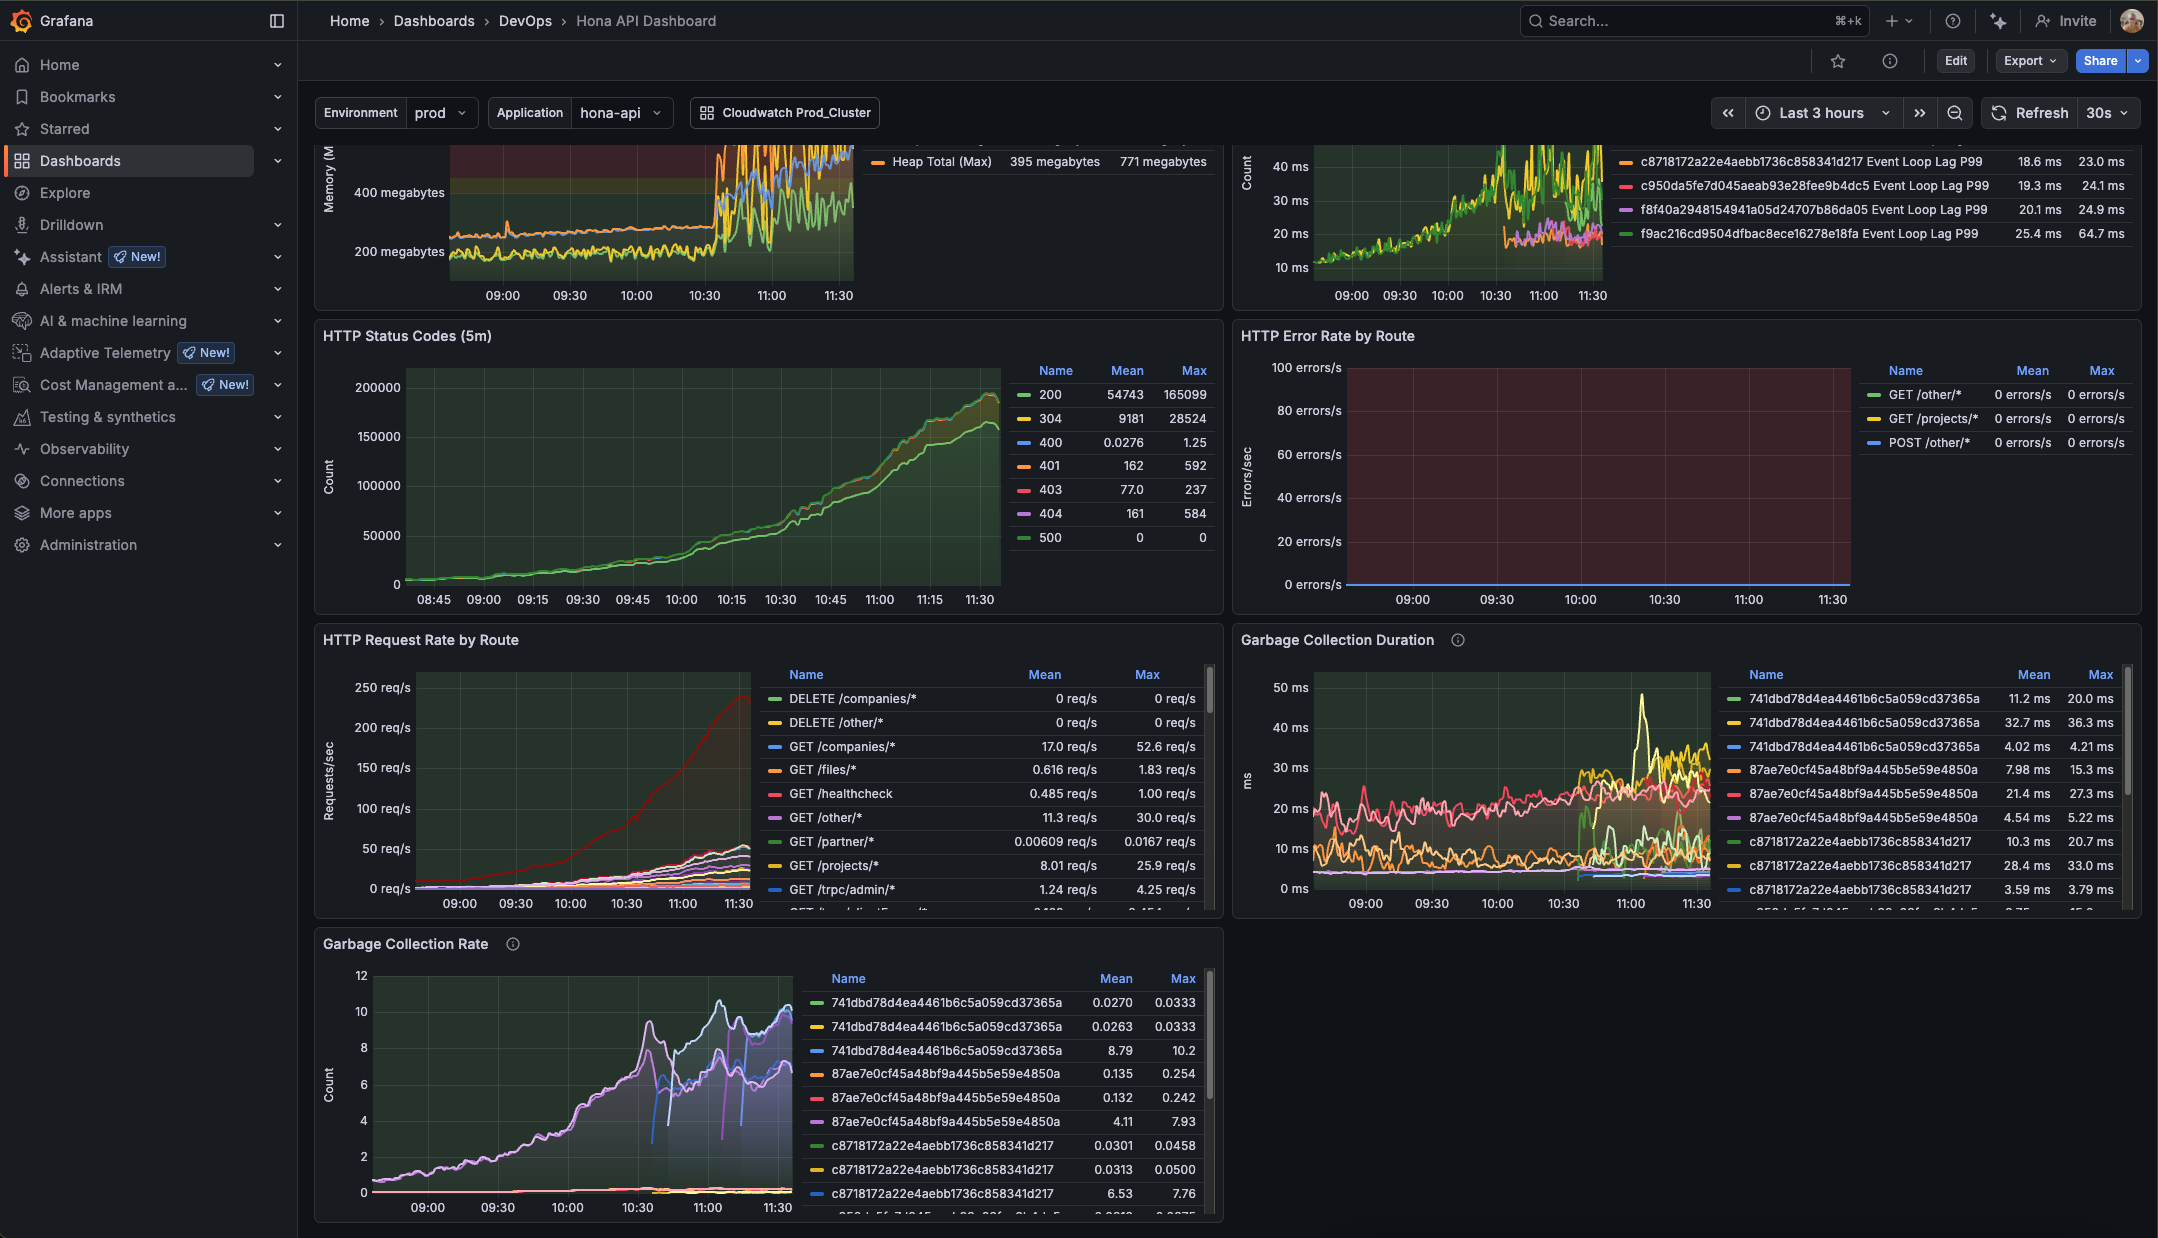
Results and impact: Full visibility, developer empowerment, and fast iteration
With Grafana Cloud in place, Hona now has:
- True end-to-end observability. Developers can finally understand what is happening inside their services.
- Reliable SLOs for every microservice. Service reliability is now more measurable and scalable.
- Rapid dashboard growth. “We see new dashboards being created almost every month,” Delgado said.
- Faster investigations and fewer blind spots. Teams track errors, latency, and behavior across services with confidence.
- Predictable costs. Grafana Cloud allows Hona to avoid the operational overhead of self-hosting.
- Higher adoption across teams. Developers now build their own dashboards and widgets instead of relying on the DevOps team.
“Almost every month, new dashboards appear,” Delgado said. “The response has been fantastic.”
Future outlook: Expanding observability as Hona grows
Hona continues to scale its platform, especially around voice AI and automated client-communication workflows. The team expects to expand its use of Grafana Cloud as data grows.
“There’s still room to grow with Grafana Cloud,” Delgado said. “Every new microservice is created with observability built in.”
For Hona, Grafana Cloud didn’t just replace CloudWatch dashboards—it gave developers the confidence and clarity they needed to build faster, maintain reliability, and modernize their platform.
As Delgado summed it up: “Grafana Cloud lets us understand our services, create real SLOs, and fix problems before they affect customers. It’s become essential to how we build.”